Fig. 4.
Download original image
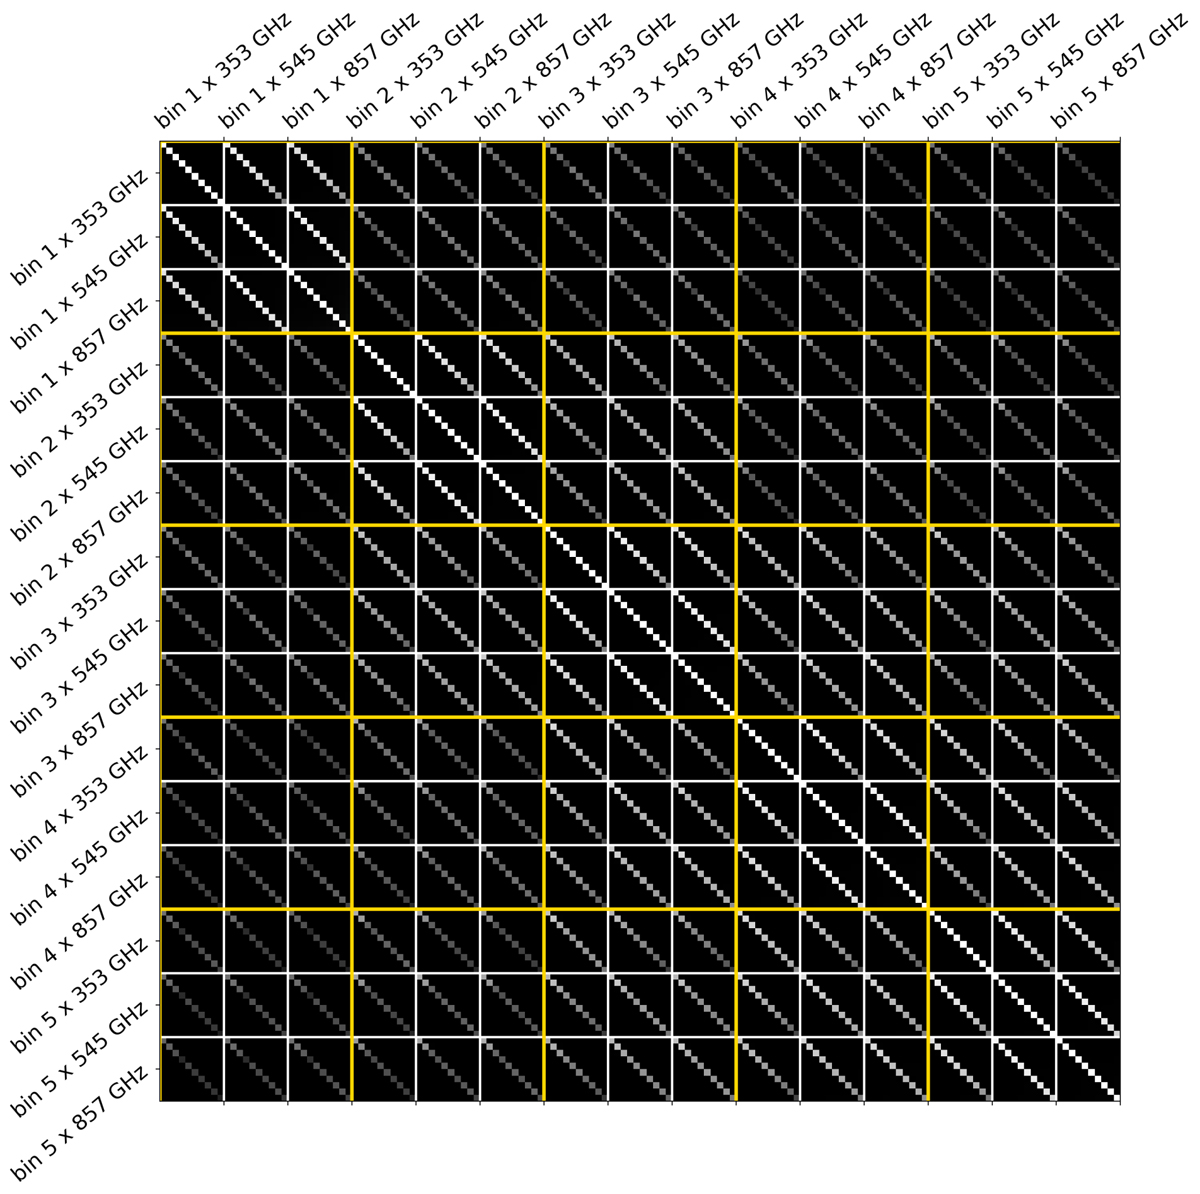
Correlation coefficient matrix of our cross-correlation measurements. The colour scale is from 0 (black) to 1 (white). Each block enclosed by a white grid is the covariance between each pair of cross-correlations indicated with ticks (bin p × ν GHz), while that enclosed by a golden grid corresponds to the covariance between the CIB cross-galaxies from each pair of tomographic bins. The matrix has non-zero elements at all cells, but the off-diagonal elements in each cross-correlation are vanishingly small.
Current usage metrics show cumulative count of Article Views (full-text article views including HTML views, PDF and ePub downloads, according to the available data) and Abstracts Views on Vision4Press platform.
Data correspond to usage on the plateform after 2015. The current usage metrics is available 48-96 hours after online publication and is updated daily on week days.
Initial download of the metrics may take a while.