Fig. A.1.
Download original image
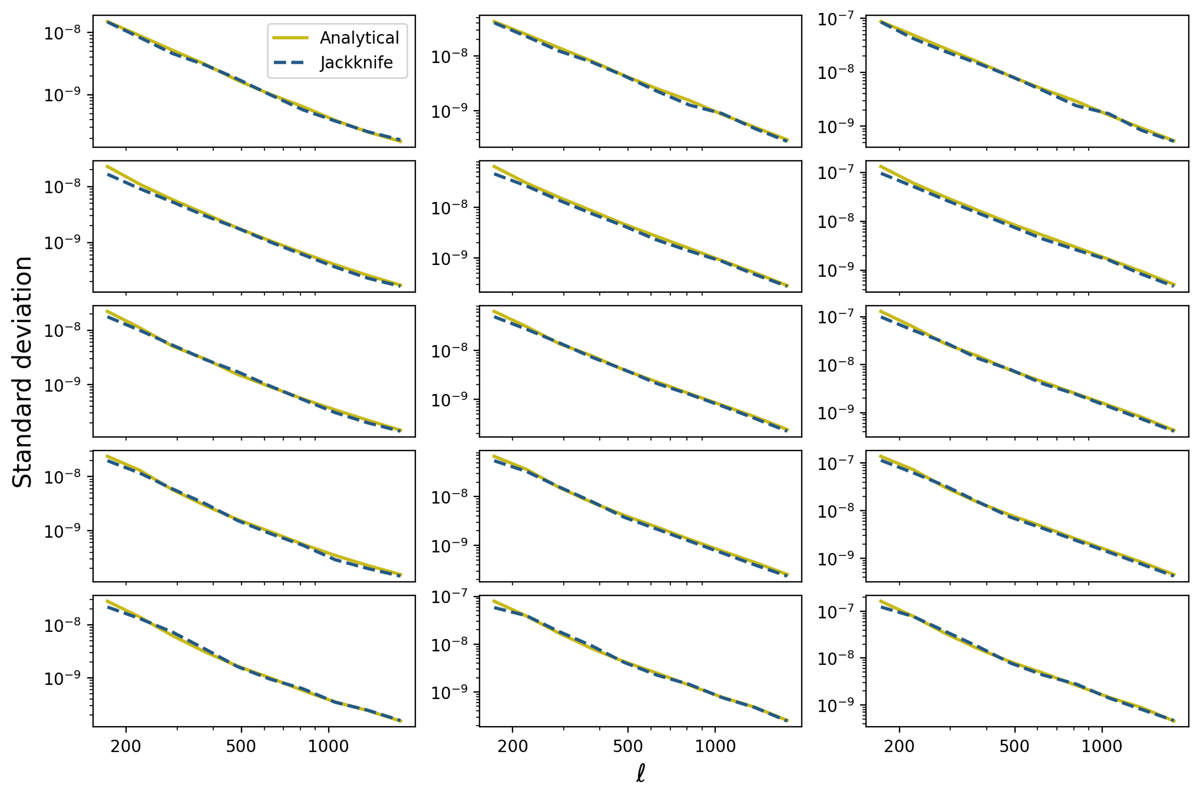
Comparison between the standard deviation of ![]() obtained from the diagonal terms of the analytical (the beige lines) and jackknife (the dashed dark blue lines) covariance matrices. Each panel corresponds to one cross-correlation signal. The three columns represent three CIB channels in increasing order from left to right; the five rows represent five KiDS tomographic bins in increasing order from top to bottom.
obtained from the diagonal terms of the analytical (the beige lines) and jackknife (the dashed dark blue lines) covariance matrices. Each panel corresponds to one cross-correlation signal. The three columns represent three CIB channels in increasing order from left to right; the five rows represent five KiDS tomographic bins in increasing order from top to bottom.
Current usage metrics show cumulative count of Article Views (full-text article views including HTML views, PDF and ePub downloads, according to the available data) and Abstracts Views on Vision4Press platform.
Data correspond to usage on the plateform after 2015. The current usage metrics is available 48-96 hours after online publication and is updated daily on week days.
Initial download of the metrics may take a while.