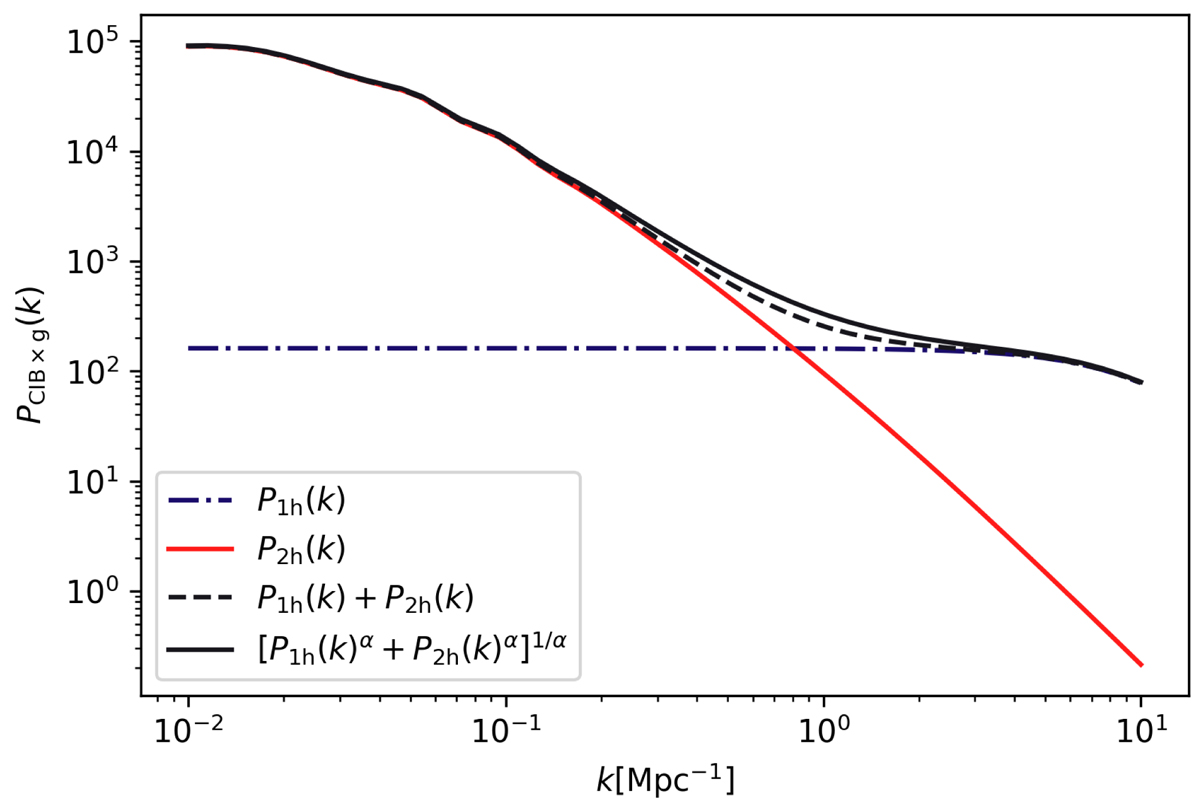
Fig. 1.
Download original image
Halo model of the power spectrum of CIB-galaxy cross-correlation at z = 0. The power spectrum in this plot only shows the spatial dependence of the correlation between the CIB and galaxy distribution, with all the irrelevant terms (redshift and frequency dependence) factored out, so the unit is arbitrary. The dash-dotted purple line and the solid red line are one- and two-halo terms, respectively; the dashed black line is the summation of one- and two-halo terms, and the solid black line is the smoothed power spectrum defined in Eq. (4).
Current usage metrics show cumulative count of Article Views (full-text article views including HTML views, PDF and ePub downloads, according to the available data) and Abstracts Views on Vision4Press platform.
Data correspond to usage on the plateform after 2015. The current usage metrics is available 48-96 hours after online publication and is updated daily on week days.
Initial download of the metrics may take a while.