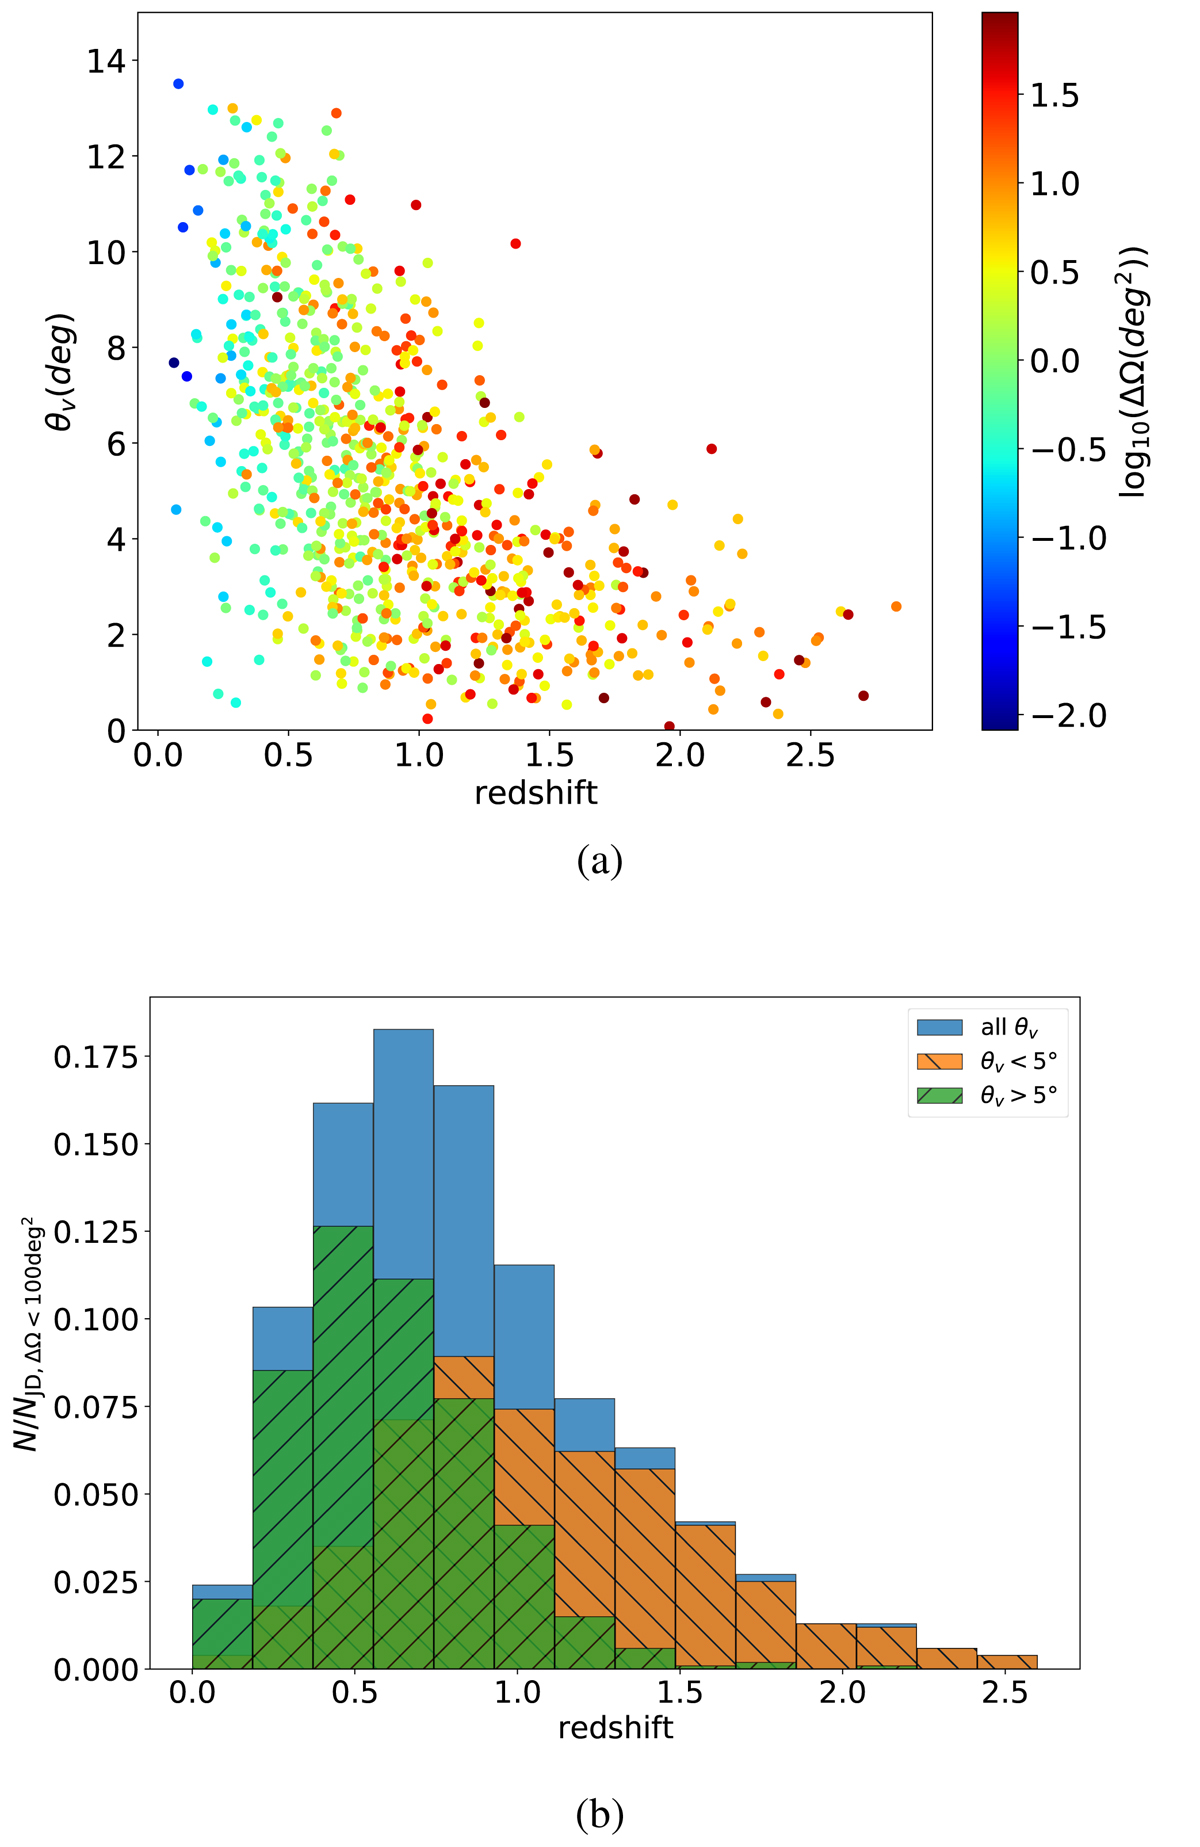
Fig. 8.
Download original image
Redshift distribution of the joint GW+X-ray detections. Panel a: shows the distribution of the viewing angle as a function of redshift for a sample of 1000 joint GW+X-ray detections, considering ET+2CE and SXI and under the assumption Stru1. Only BNS detections with GW sky localization ΔΩ < 100 deg2 are selected. The assumed jet core angle is θc = 3.4 deg. The color bar indicates the GW sky localization uncertainty of each detection. Panel b: the distribution in redshift of the same sample, where we distinguish between detections with θv < 5° and θv > 5°. The histogram is normalized to the number of total joint detections with ΔΩ < 100 deg2.
Current usage metrics show cumulative count of Article Views (full-text article views including HTML views, PDF and ePub downloads, according to the available data) and Abstracts Views on Vision4Press platform.
Data correspond to usage on the plateform after 2015. The current usage metrics is available 48-96 hours after online publication and is updated daily on week days.
Initial download of the metrics may take a while.