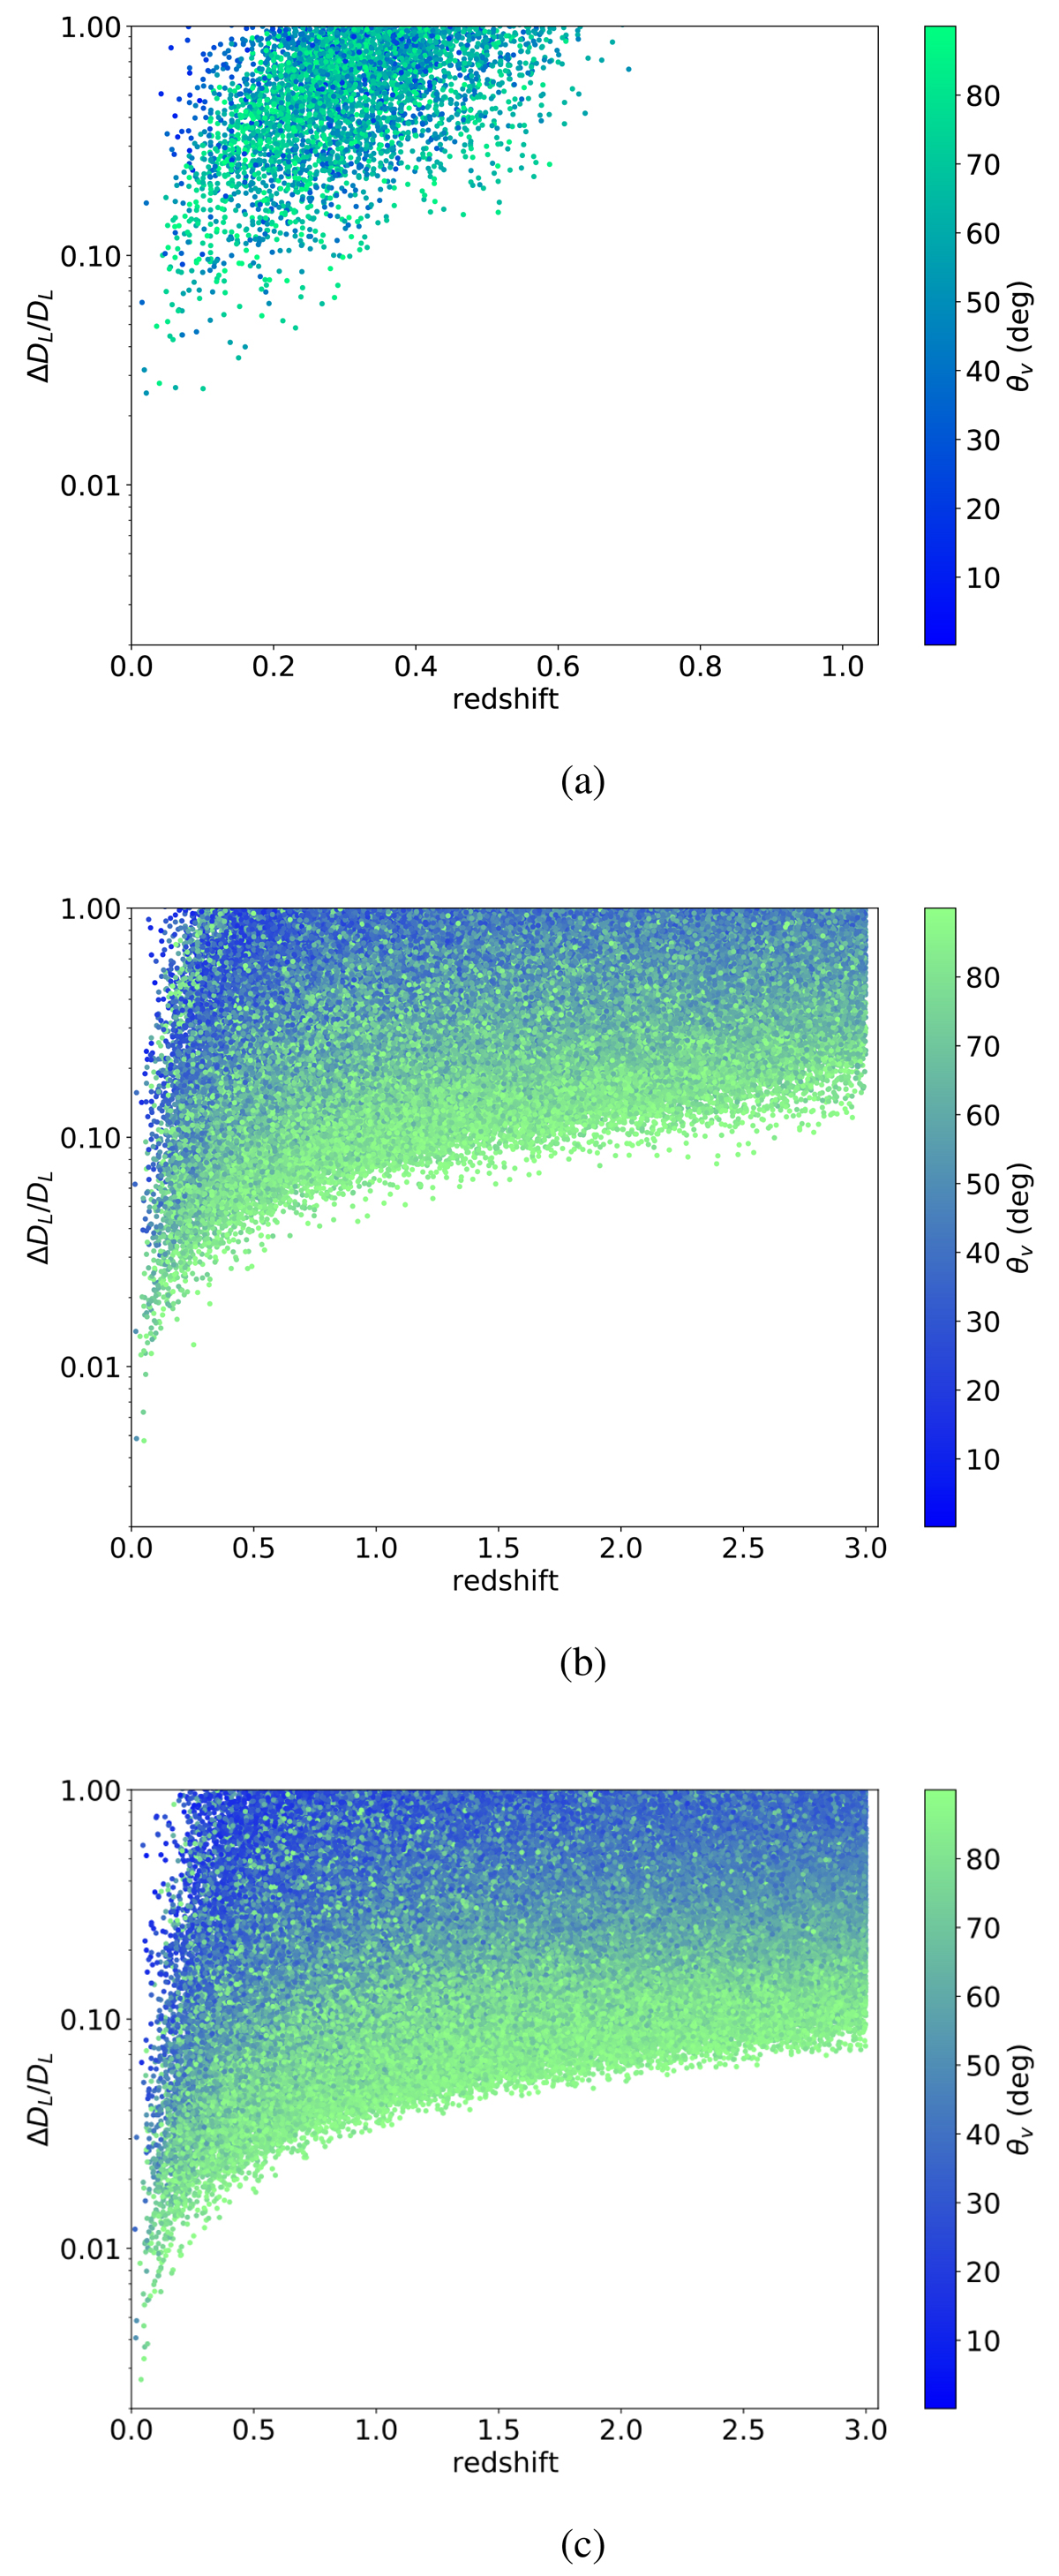
Fig. 7.
Download original image
Distribution of the relative error on the luminosity distance DL as a function of redshift relative to one year of observation, in the case of ET (a), ET+CE (b) and ET+2CE (c). The color bar indicates the viewing angle. Only cases with ΔDL/DL < 1 and at z < 3 are shown. A duty cycle of 0.85 has been assumed for the GW detectors as described in the text.
Current usage metrics show cumulative count of Article Views (full-text article views including HTML views, PDF and ePub downloads, according to the available data) and Abstracts Views on Vision4Press platform.
Data correspond to usage on the plateform after 2015. The current usage metrics is available 48-96 hours after online publication and is updated daily on week days.
Initial download of the metrics may take a while.