Open Access
Fig. B.5.
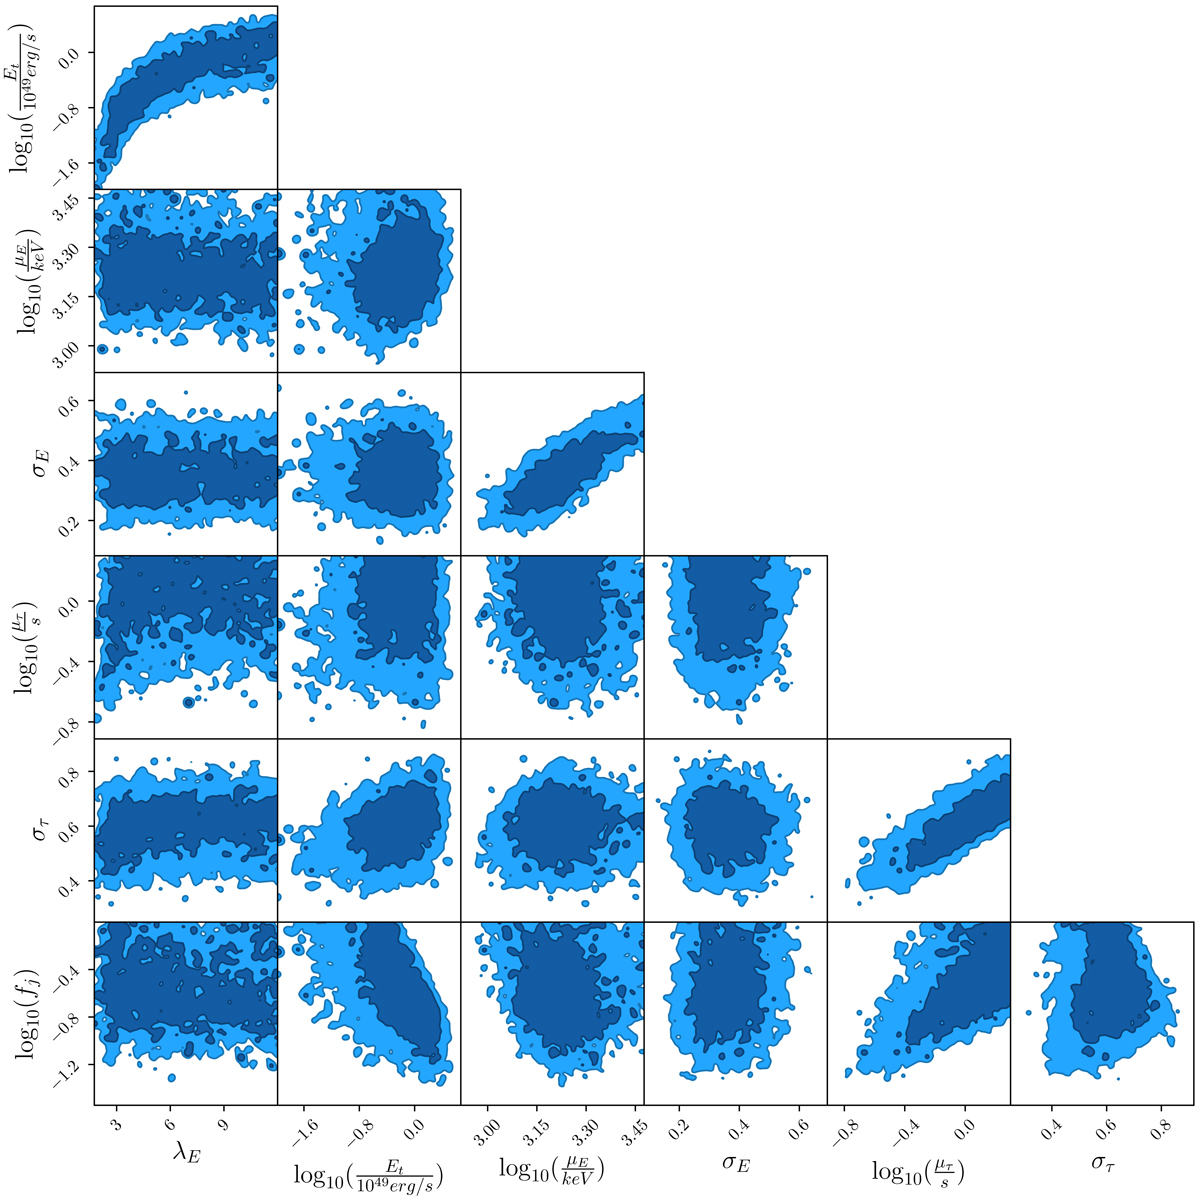
Download original image
Corner plot of the posterior distribution of the parameters adopted for the prompt emission model. The assumed structure is Stru1. The number of MCMC steps is chosen such that the auto-correlation time reaches a plateau, as described in Foreman-Mackey et al. (2013).
Current usage metrics show cumulative count of Article Views (full-text article views including HTML views, PDF and ePub downloads, according to the available data) and Abstracts Views on Vision4Press platform.
Data correspond to usage on the plateform after 2015. The current usage metrics is available 48-96 hours after online publication and is updated daily on week days.
Initial download of the metrics may take a while.