Open Access
Fig. 9
Download original image
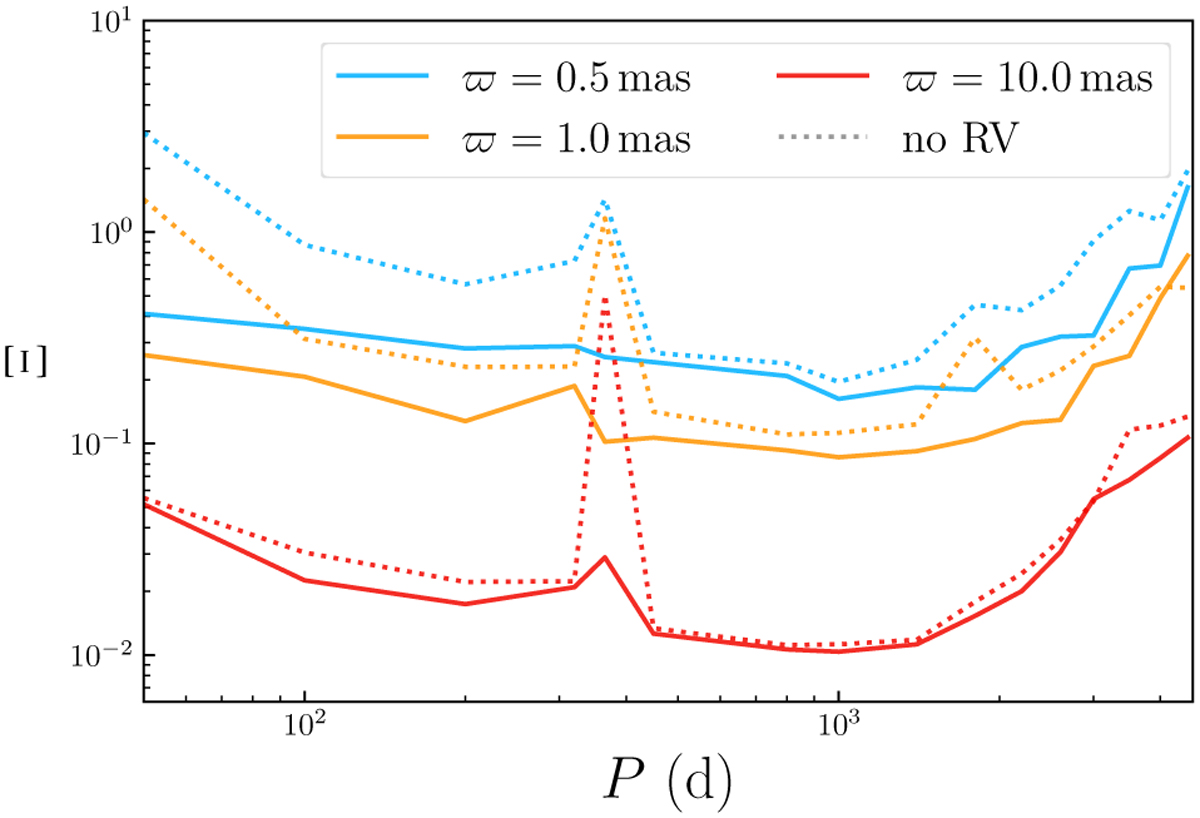
Values of Ξ of a NS-dwarf system (1.4 M⊙ – 1 M⊙) with inclination angle i = 30°. Sources at [10, 1, 0.5] mas are plotted in red, yellow, and blue, respectively. As a comparison, the dashed line is plotted in the same colour as the Ξ of the same source with no RV data.
Current usage metrics show cumulative count of Article Views (full-text article views including HTML views, PDF and ePub downloads, according to the available data) and Abstracts Views on Vision4Press platform.
Data correspond to usage on the plateform after 2015. The current usage metrics is available 48-96 hours after online publication and is updated daily on week days.
Initial download of the metrics may take a while.