Fig. 3
Download original image
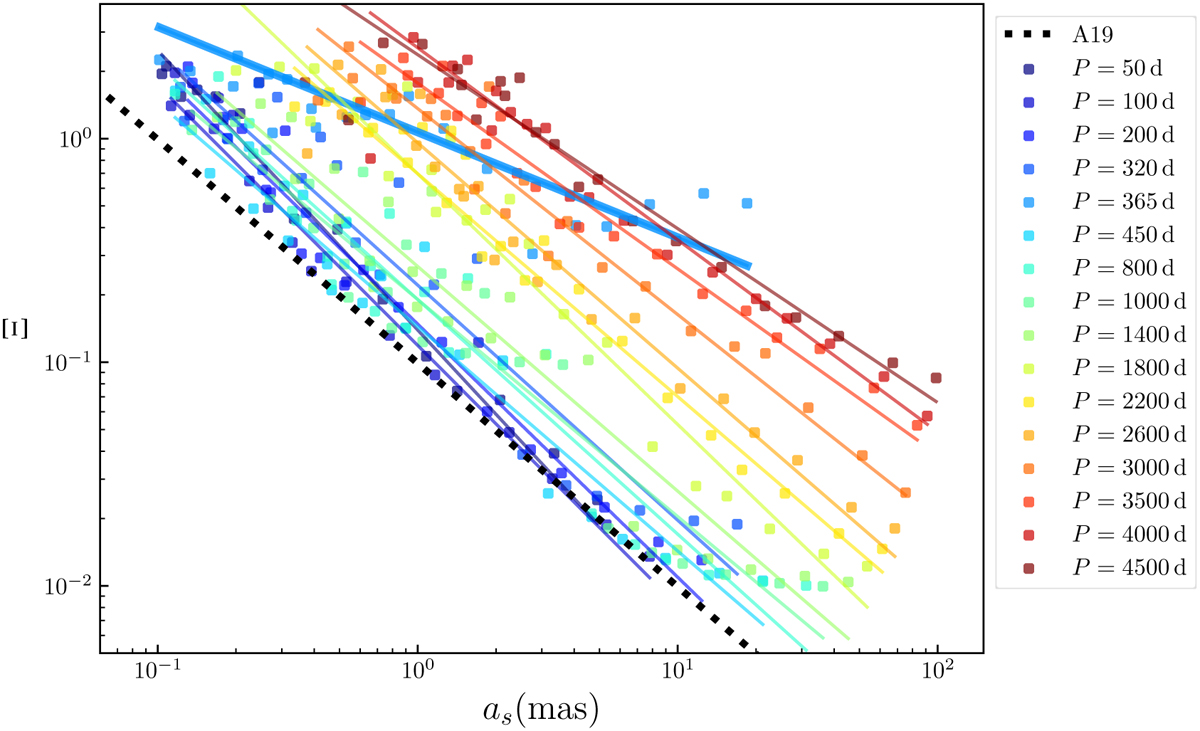
Main relation Φ0 constructed by a set of fitted lines. The simulation results are shown as points of different colours for different periods, from 50 days to 4500 days (see legend at right), while a series of fitted lines in the log – log space are also plotted in the same colour. The thick blue line is the fitting result of P = 1 yr. For comparison, the dotted line shows the result of A19, calculated by Eq. (9).
Current usage metrics show cumulative count of Article Views (full-text article views including HTML views, PDF and ePub downloads, according to the available data) and Abstracts Views on Vision4Press platform.
Data correspond to usage on the plateform after 2015. The current usage metrics is available 48-96 hours after online publication and is updated daily on week days.
Initial download of the metrics may take a while.