Fig. 10
Download original image
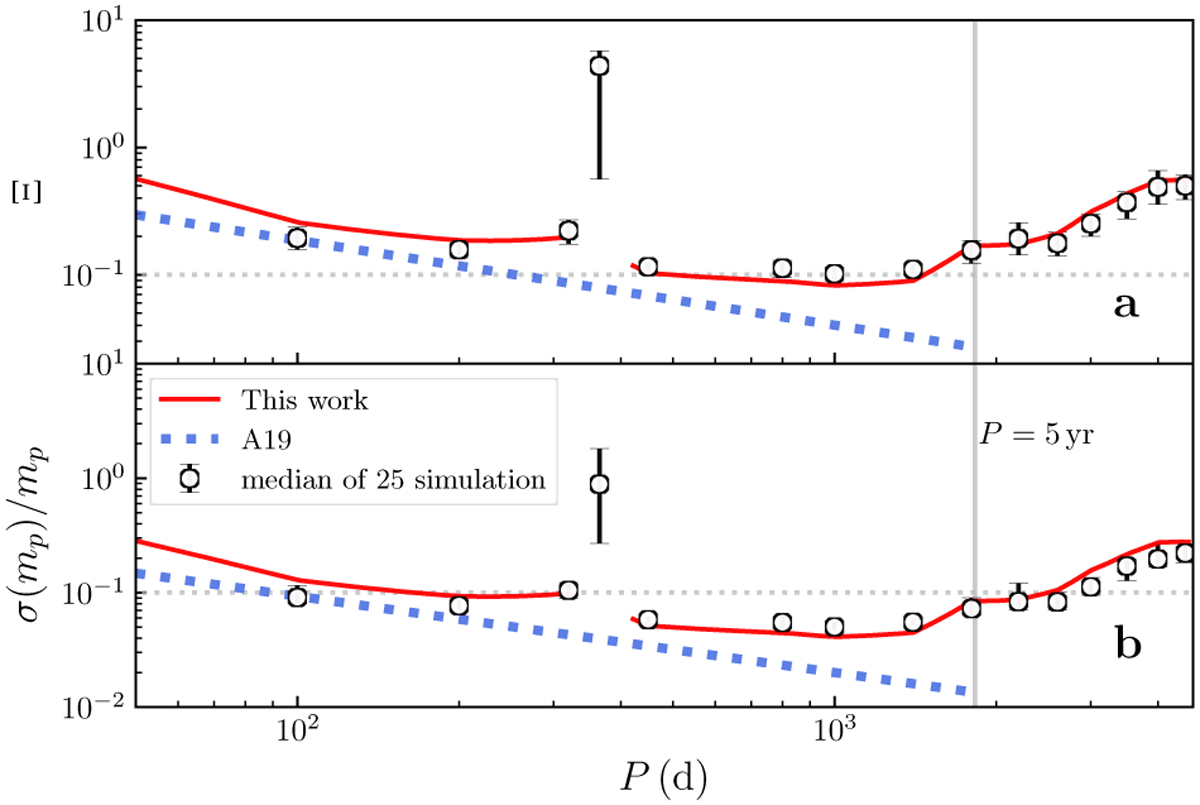
One example of a simulated source and the Ξ-relation. (a) Median of Ξ (black points) calculated from the simulation result in Sect. 3.10 and the prediction of our model (red line) and the A19 model (blue dashed line). (b) Median of ![]() (black points) obtained from the simulation result directly, and the predicted
(black points) obtained from the simulation result directly, and the predicted ![]() by applying Eq. (7) to our predicted Ξ (red line) and that of A19 (blue dashed line). In both panels the grey vertical line indicates the 5 yr limit in the A19 model, and the grey horizontal dashed line shows the difference in Ξ and
by applying Eq. (7) to our predicted Ξ (red line) and that of A19 (blue dashed line). In both panels the grey vertical line indicates the 5 yr limit in the A19 model, and the grey horizontal dashed line shows the difference in Ξ and ![]() . The interruption of our model around 1yr is determined by Φ1(P).
. The interruption of our model around 1yr is determined by Φ1(P).
Current usage metrics show cumulative count of Article Views (full-text article views including HTML views, PDF and ePub downloads, according to the available data) and Abstracts Views on Vision4Press platform.
Data correspond to usage on the plateform after 2015. The current usage metrics is available 48-96 hours after online publication and is updated daily on week days.
Initial download of the metrics may take a while.