Fig. 1
Download original image
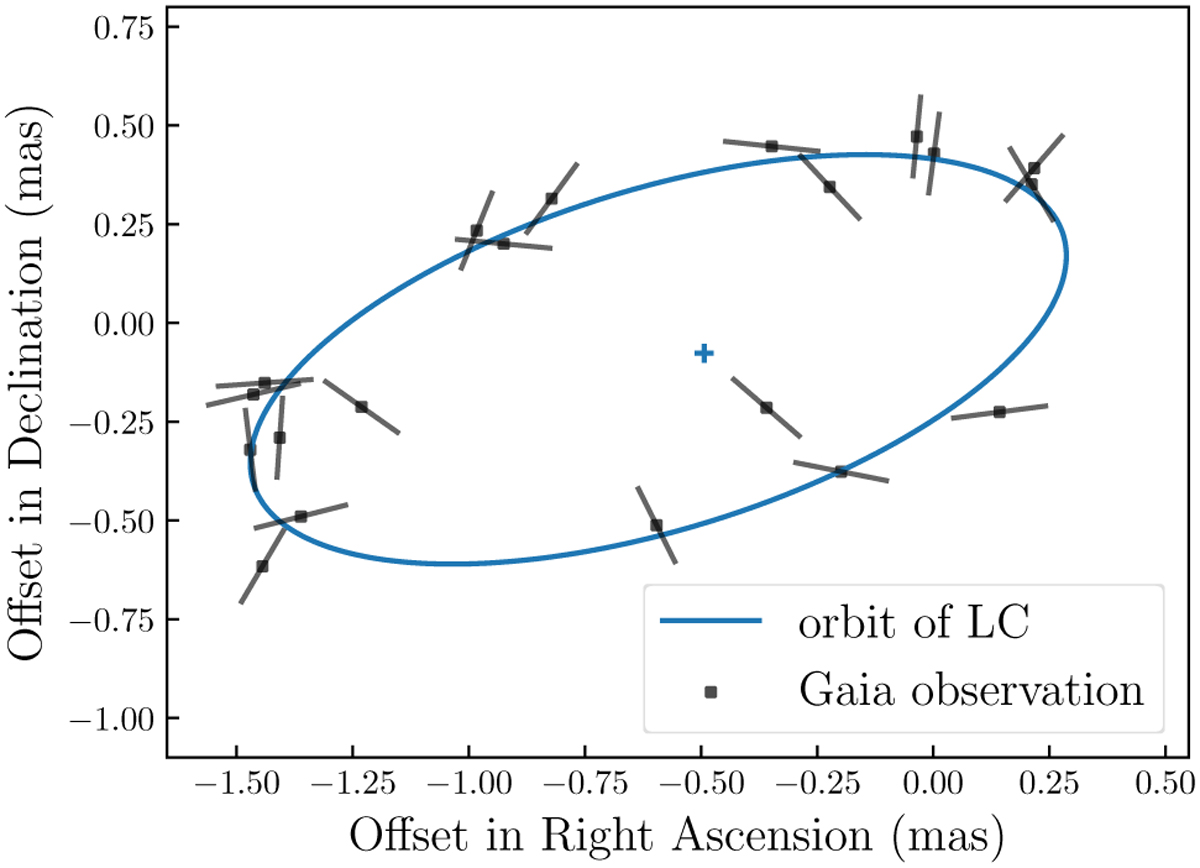
Schematic diagram of the sky-projected orbit of the luminous component and the Gaia epoch data. The central blue cross is the barycentre. The blue line shows the binary orbit of the luminous star. The black points are the mock Gaia epoch data, which show offsets from the orbit. These offsets are caused by the uncertainty in AL direction, indicated by the orientation of the error bar. All the points omit the proper motion and the annual motion.
Current usage metrics show cumulative count of Article Views (full-text article views including HTML views, PDF and ePub downloads, according to the available data) and Abstracts Views on Vision4Press platform.
Data correspond to usage on the plateform after 2015. The current usage metrics is available 48-96 hours after online publication and is updated daily on week days.
Initial download of the metrics may take a while.