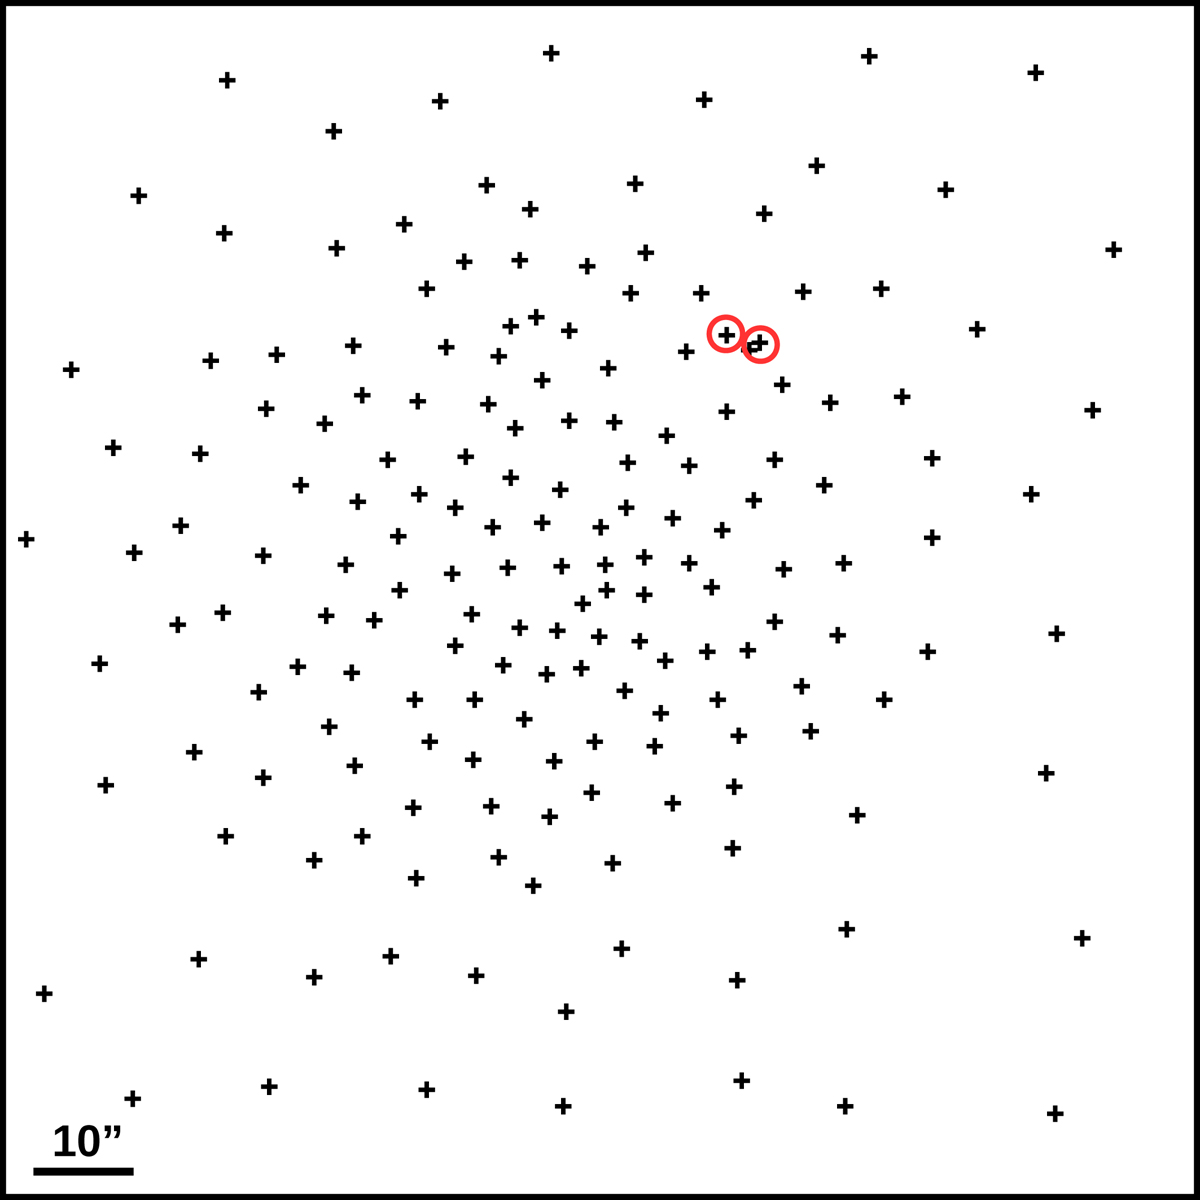
Fig. A.1.
Download original image
Distribution of grid points in the dynamical grid used to perform the reconstruction. This distribution is derived from a Monte-Carlo realization of a previous solution. Areas with a higher surface mass density have a higher concentration of grid points. The red circles mark the two additional grid points added to account for the two background galaxies near the sunburst arc at redshifts 0.5578 and 0.7346.
Current usage metrics show cumulative count of Article Views (full-text article views including HTML views, PDF and ePub downloads, according to the available data) and Abstracts Views on Vision4Press platform.
Data correspond to usage on the plateform after 2015. The current usage metrics is available 48-96 hours after online publication and is updated daily on week days.
Initial download of the metrics may take a while.