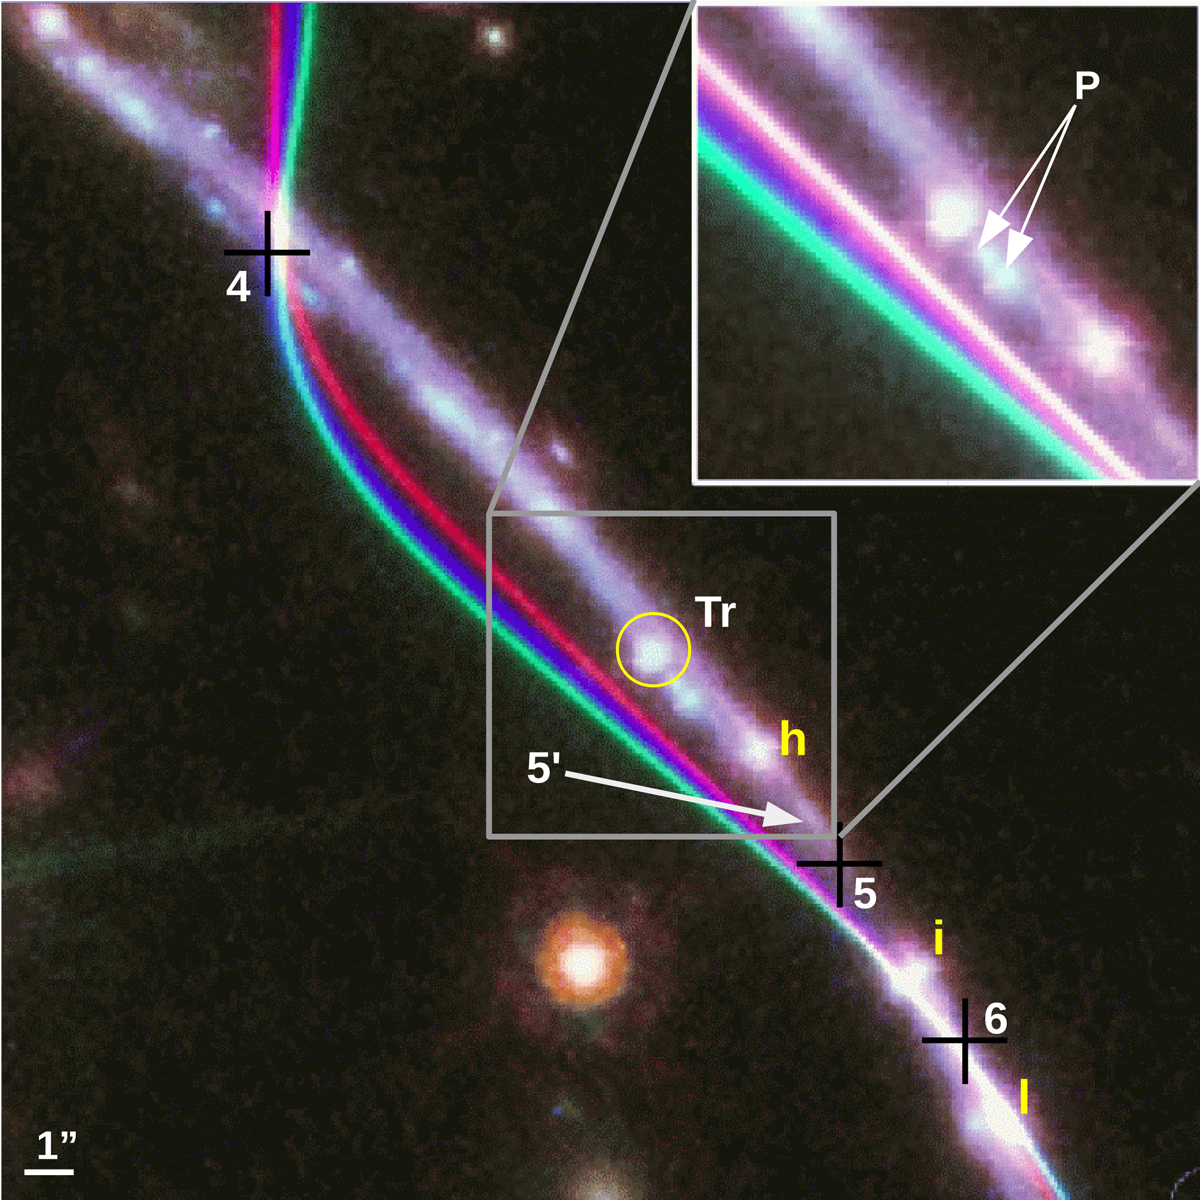
Fig. 5.
Download original image
Variability of the critical curves near the position Tr. The blue critical curve corresponds to the same model shown in blue in Fig. 2. The red curve is for a model derived with the same configuration but with half the number of iterations. The green curve is for an alternative model for the same number of iterations as the blue curve, but with a different realization of the grid. The crosses mark the position of the critical points used as constraints. Knot number 1 for system 5 is marked with yellow labels (h,i,l). The white arrow marks a possible alternative location (5′) for the critical point 5. Using this position 5′ as a constraint instead of position 5, brings the critical curve a bit closer to the position Tr (white curve in the inset in the top-right corner).
Current usage metrics show cumulative count of Article Views (full-text article views including HTML views, PDF and ePub downloads, according to the available data) and Abstracts Views on Vision4Press platform.
Data correspond to usage on the plateform after 2015. The current usage metrics is available 48-96 hours after online publication and is updated daily on week days.
Initial download of the metrics may take a while.