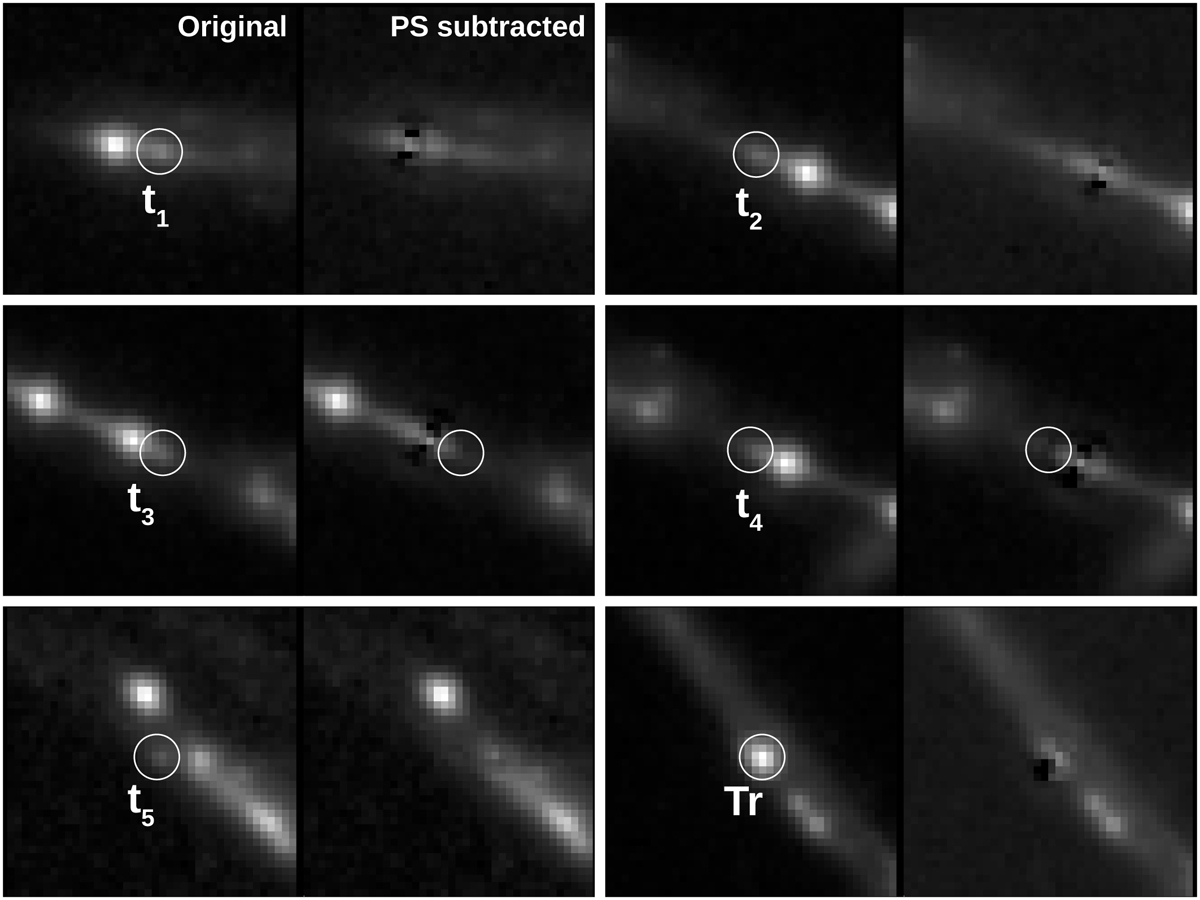
Fig. E.4.
Download original image
PSF model fitting to the sources in t1–t5 and Tr. For each pair of images, the left panel shows the original F606W band, with the source being fitted marked by a circle. In all panels, except in the bottom right, a brighter nearby source is subtracted before. In each case, the right panel shows the image after subtracting the point sources. For t3 and t4, the right panel also marks with a circle the original position if the source being subtracted.
Current usage metrics show cumulative count of Article Views (full-text article views including HTML views, PDF and ePub downloads, according to the available data) and Abstracts Views on Vision4Press platform.
Data correspond to usage on the plateform after 2015. The current usage metrics is available 48-96 hours after online publication and is updated daily on week days.
Initial download of the metrics may take a while.