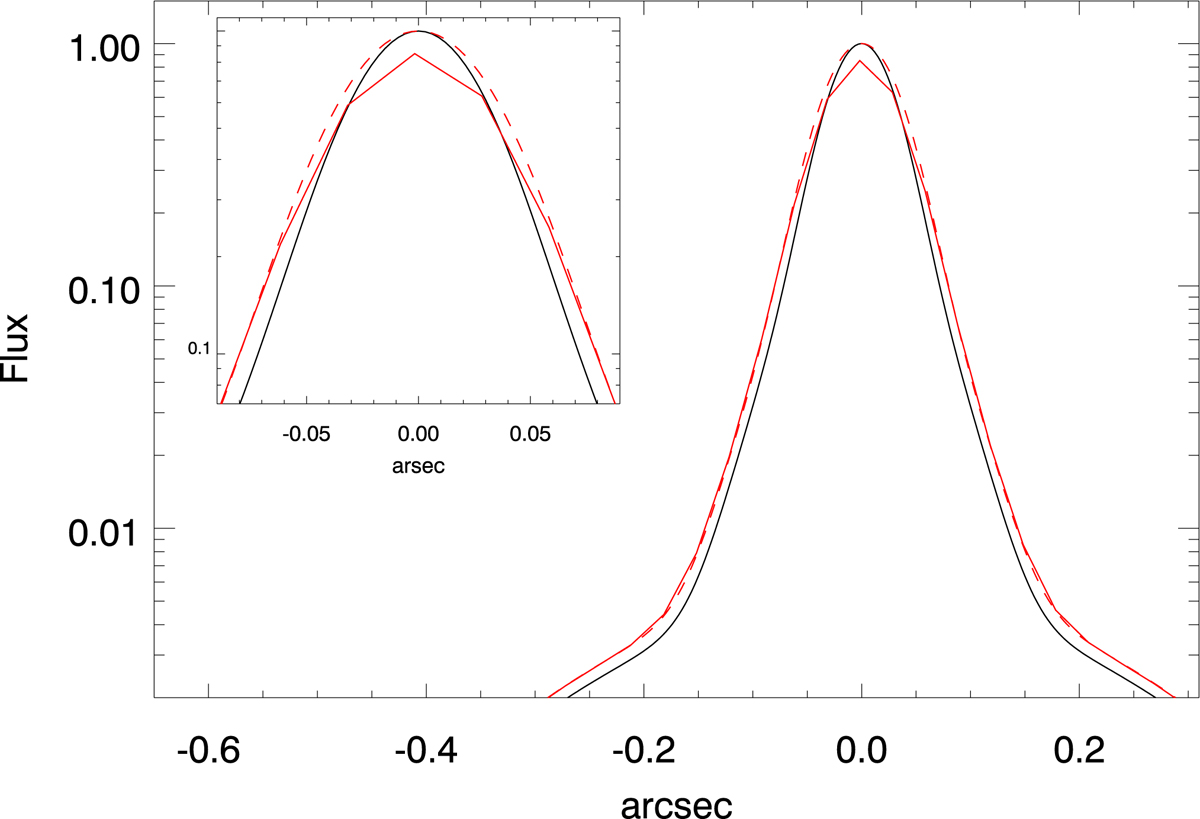
Fig. E.2.
Download original image
Simulated profile of a pair of images separated by 30 mas. The solid black curve shows the PSF model. The solid red curve is the resulting profile after convolving the two images by the PSF model. The red dashed line is the corresponding profile after re-pixelizing the simulated data to the 30 mas pixel in HST. As in in Fig. E.1, the inset covers a zoomed version near the peak.
Current usage metrics show cumulative count of Article Views (full-text article views including HTML views, PDF and ePub downloads, according to the available data) and Abstracts Views on Vision4Press platform.
Data correspond to usage on the plateform after 2015. The current usage metrics is available 48-96 hours after online publication and is updated daily on week days.
Initial download of the metrics may take a while.