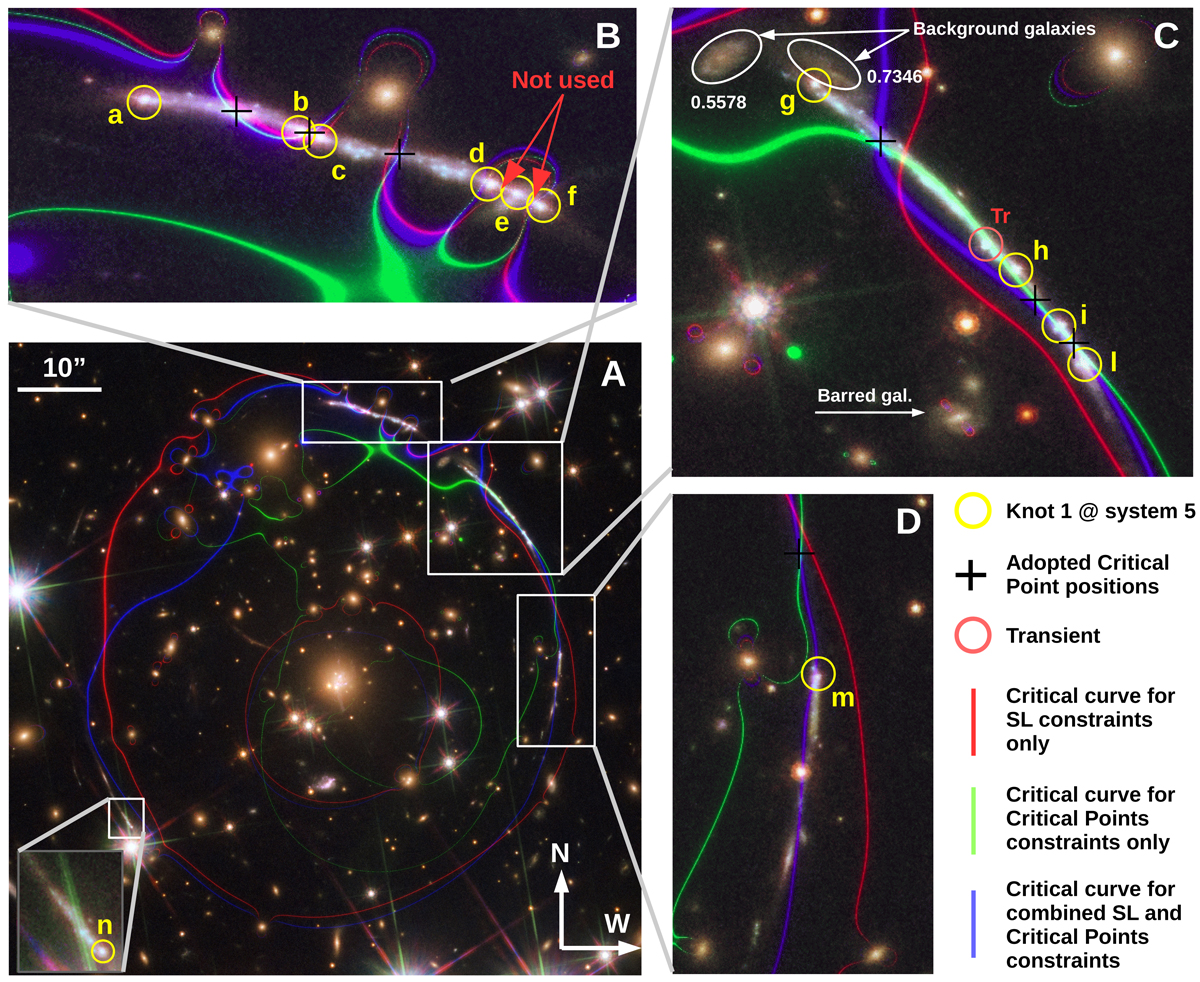
Fig. 2.
Download original image
Critical curves at the redshift of the Sunburst arc for three different models derived using different combinations of constraints. The red critical curve shows the case where only strong lensing (SL) arc positions are used as constraints. The green critical curve corresponds to the case where only the adopted position of the critical points are used as constraints. Finally the blue critical curve is for the model where both arc positions and critical point positions are used as constraints. Panel A shows the entire cluster region while panels B, C, and D show zoomed regions around selected areas including key lensing features such as the observed position of knot 5.1 in system 5 (yellow circles). The letters next to each circle follow the labeling scheme for knot 5.1 in Pignataro et al. (2021). The inferred position of the critical points used in this work are marked with black crosses. Two background galaxies at redshifts 0.5578 and 0.7346 are marked with white ellipses in panel C. The red arrows mark two critical points not used in our analysis due to the proximity of a lensing galaxy which can bias the values of κ. The white arrow marks the barred galaxy modeled independently in Pignataro et al. (2021). Finally, the red circle marks the position of Tr in Vanzella et al. (2020b). The distance between Tr and the blue curve is 0.55″.
Current usage metrics show cumulative count of Article Views (full-text article views including HTML views, PDF and ePub downloads, according to the available data) and Abstracts Views on Vision4Press platform.
Data correspond to usage on the plateform after 2015. The current usage metrics is available 48-96 hours after online publication and is updated daily on week days.
Initial download of the metrics may take a while.