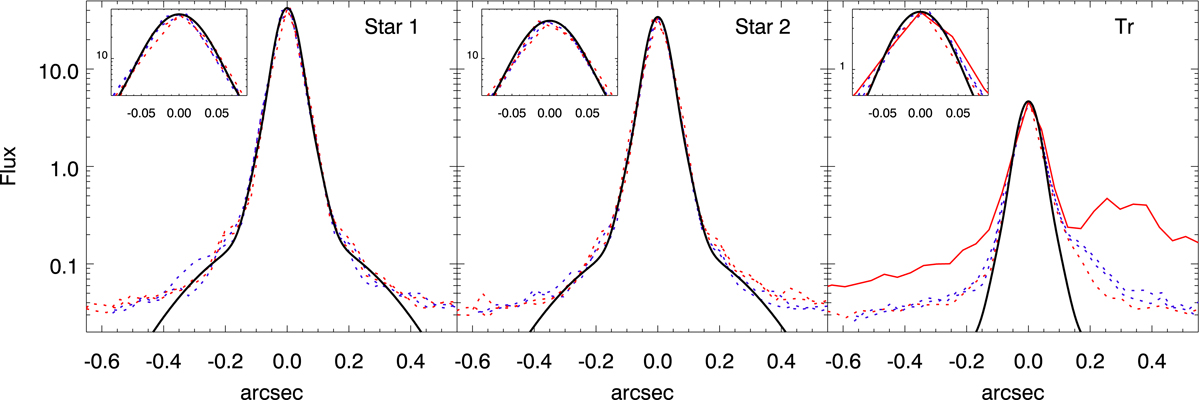
Fig. E.1.
Download original image
PSF fit model. The left and middle panel shows the profiles (dotted lines) and PSF model (solid line) for two bright stars found near Tr in the F606W band image. For each star, we derive 4 profiles. The two blue dotted lines correspond to the horizontal and vertical profiles, while the red dotted lines correspond to two profiles at 45° and -45°. The right panel shows the profiles in the same 4 directions at the position of Tr. The red dotted line is in a direction 45 degrees north to east, that is nearly perpendicular to the arc. The red solid line is in a direction -45 degrees north to east, that is close to the direction of the arc. At ≈0.3″, this profile intersects the P knots. The red solid curve is where we best expect to see a possible resolved image since it follows the direction of the shear. In all three panels, the inset shows a zoomed version near the peak, and covering approximately between the maximum of the peak to 1/10 the maximum.
Current usage metrics show cumulative count of Article Views (full-text article views including HTML views, PDF and ePub downloads, according to the available data) and Abstracts Views on Vision4Press platform.
Data correspond to usage on the plateform after 2015. The current usage metrics is available 48-96 hours after online publication and is updated daily on week days.
Initial download of the metrics may take a while.