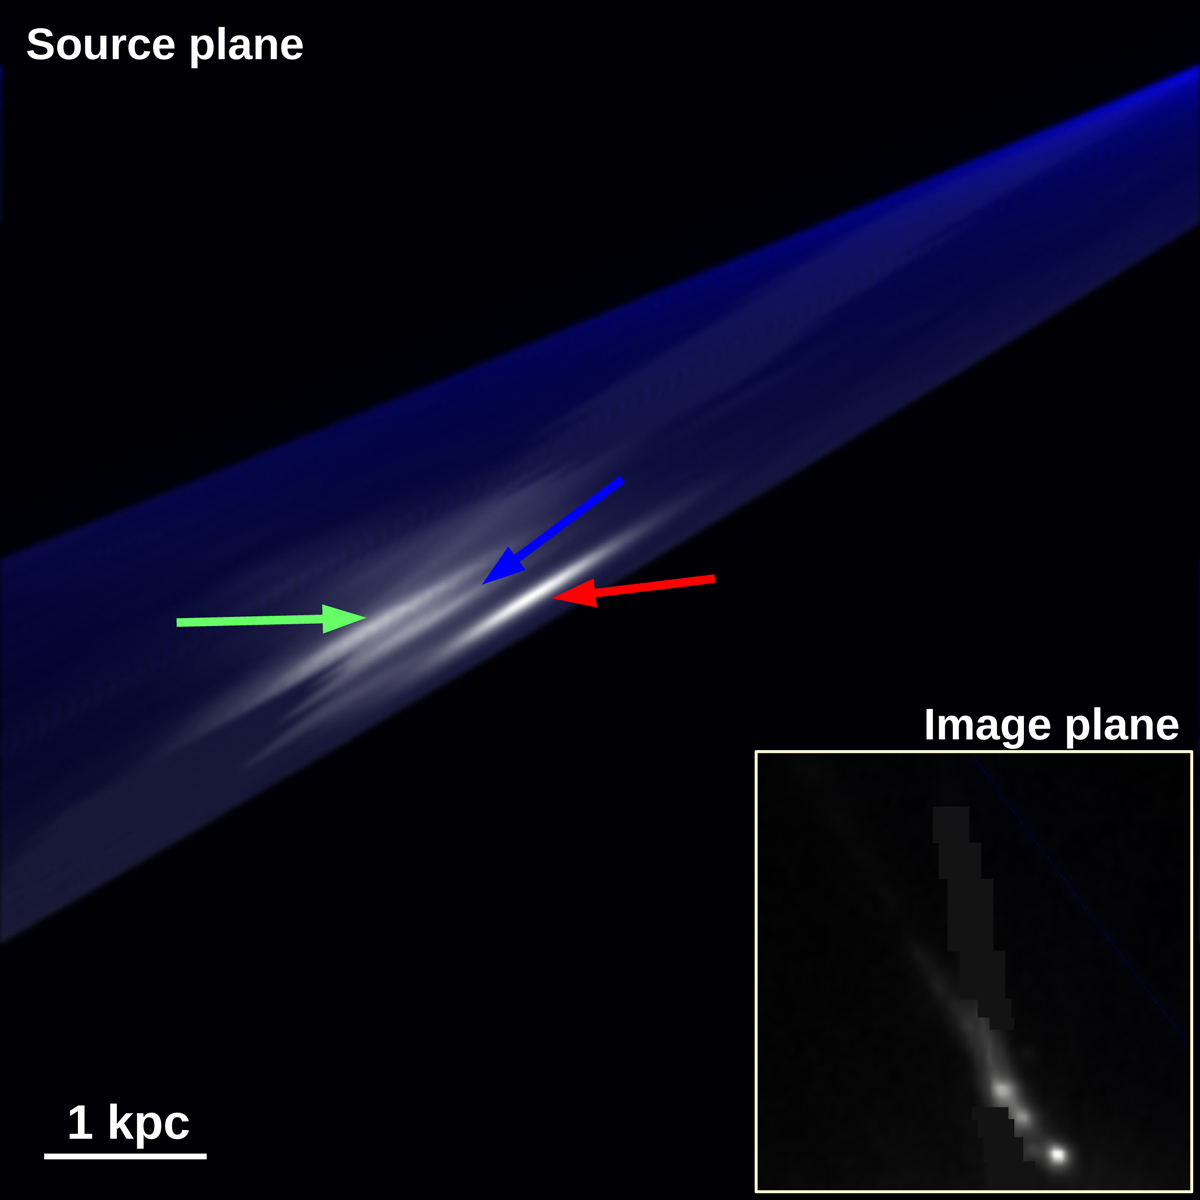
Fig. D.3.
Download original image
Reconstruction of the source based on counterimage 12 in system 5. This is the only counterimage that shows the full morphology of the arc. All other counterimages show only portions of the arc. In gray we show the source surface brightness. The blue background indicates magnification. The masked region corresponds to a diffraction spike from a nearby star. The original data is shown in the bottom right part of the figure. The blue line in the image showing the original data indicates the position of critical curve at the redshift of the source.
Current usage metrics show cumulative count of Article Views (full-text article views including HTML views, PDF and ePub downloads, according to the available data) and Abstracts Views on Vision4Press platform.
Data correspond to usage on the plateform after 2015. The current usage metrics is available 48-96 hours after online publication and is updated daily on week days.
Initial download of the metrics may take a while.