Fig. D.2.
Download original image
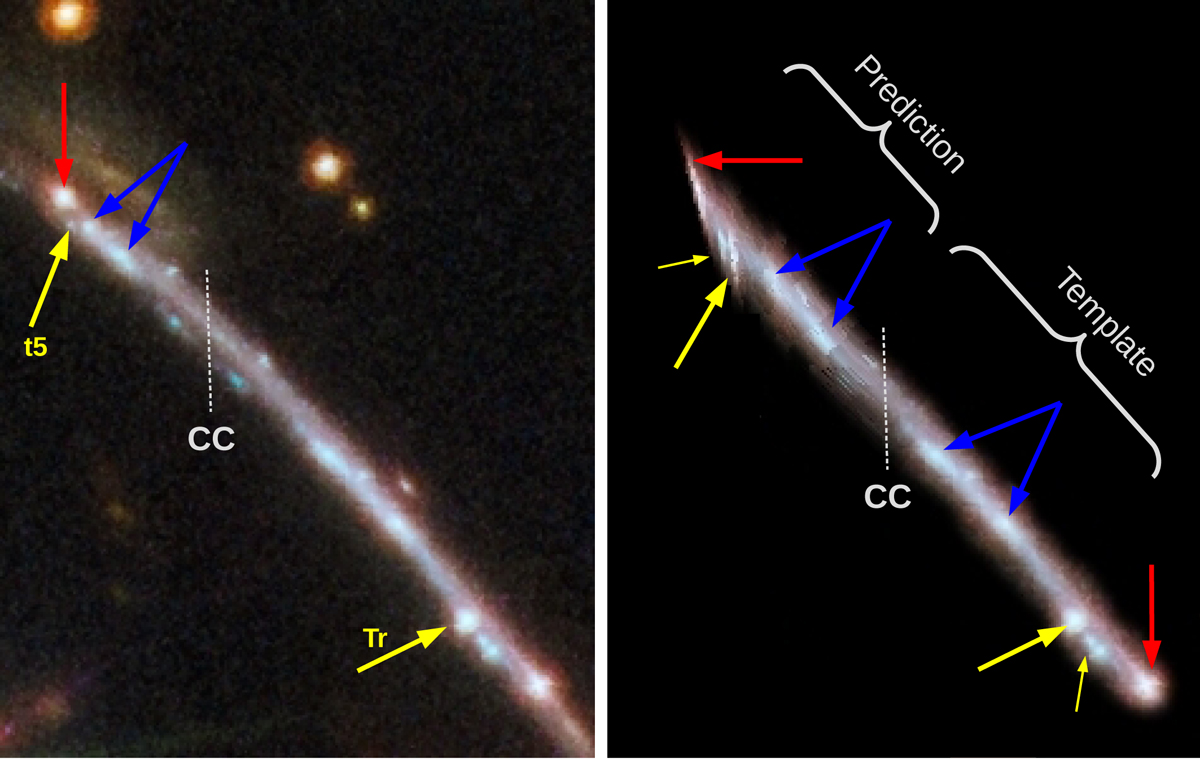
Predicted counterimage for Godzilla. The left panel shows the giant double arc containing Godzilla. The approximated position of the critical curve predicted by our lens model is marked by a dashed line. The position of Godzilla is marked by a yellow line in the southern arc. In the northern arc a small faint point source is found in the expected position of Godzilla. This is marked with a yellow arrow and labeled t5. A source is also found at the expected position of Godzilla near the LyC knot 5.1, but is partially blended with it. The predicted position of Godzilla based on the lens model is shown in the right panel, where we have used the southern part of the arc as a template to predict the northern part of the arc. Multiply lensed features are marked with arrows with the same color.
Current usage metrics show cumulative count of Article Views (full-text article views including HTML views, PDF and ePub downloads, according to the available data) and Abstracts Views on Vision4Press platform.
Data correspond to usage on the plateform after 2015. The current usage metrics is available 48-96 hours after online publication and is updated daily on week days.
Initial download of the metrics may take a while.