Fig. D.1.
Download original image
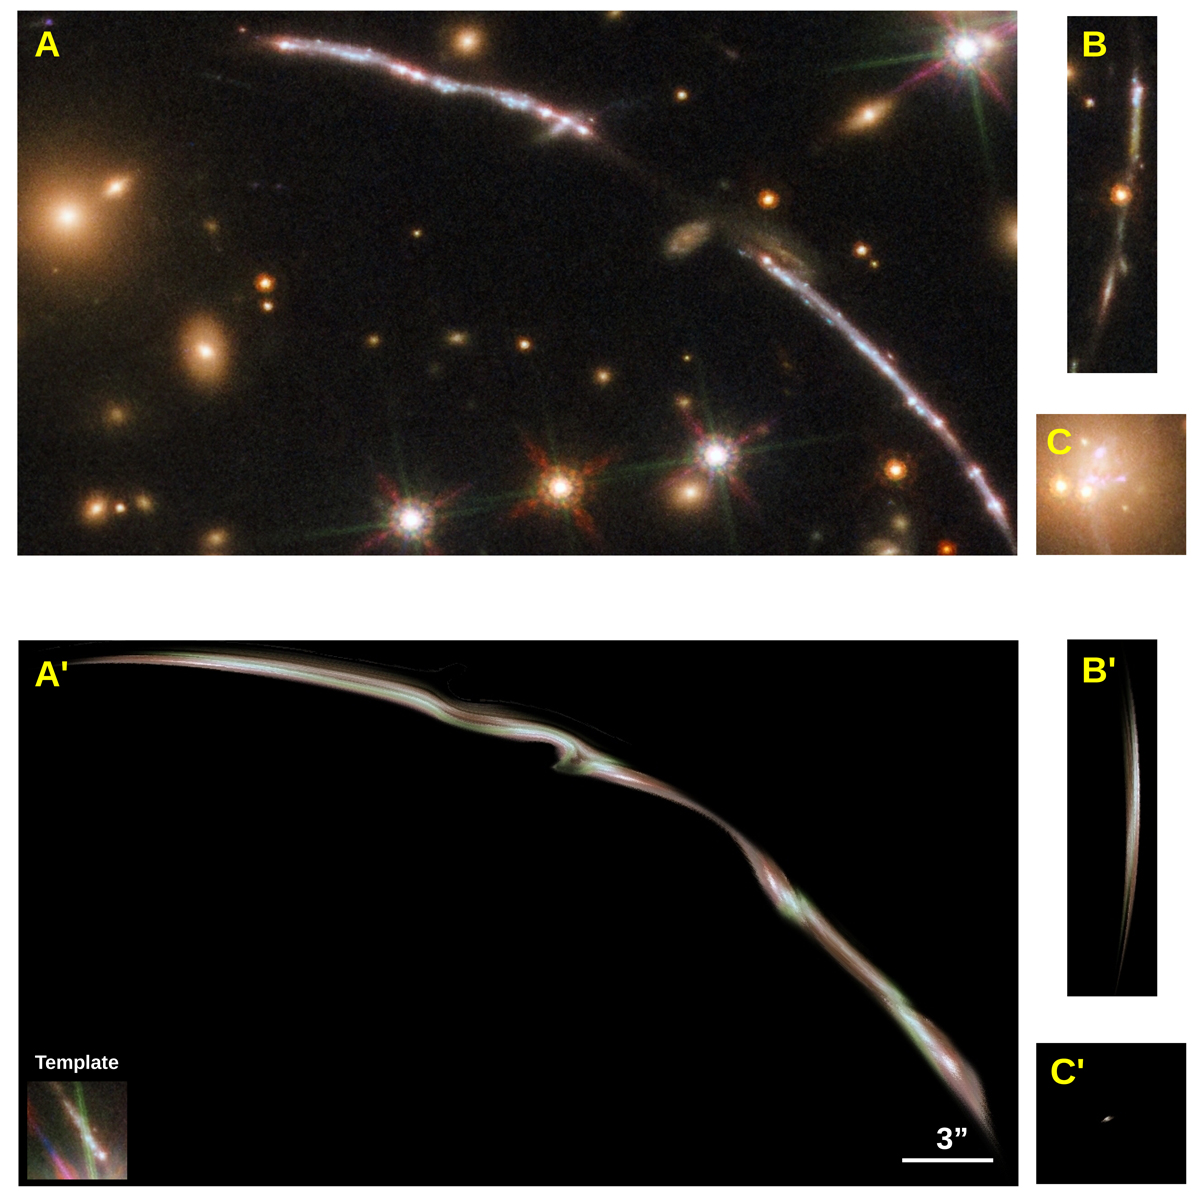
Predicted giant arcs from the lens model when the smallest counterimage of system 5 is used as a template. The small inset in the bottom-left part of panel A’ shows the template. Panels A’, B’ and C’ in the bottom part of the figure show the predicted counterimages from this template. Panels A, B, and C show the data version in the same portion of the sky as in panels A’, B’, C’. We note that the predicted central counterimage C’ has not been identified spectroscopically, but small blue knots can be found near the center of the BCG.
Current usage metrics show cumulative count of Article Views (full-text article views including HTML views, PDF and ePub downloads, according to the available data) and Abstracts Views on Vision4Press platform.
Data correspond to usage on the plateform after 2015. The current usage metrics is available 48-96 hours after online publication and is updated daily on week days.
Initial download of the metrics may take a while.