Open Access
Fig. C.3.
Download original image
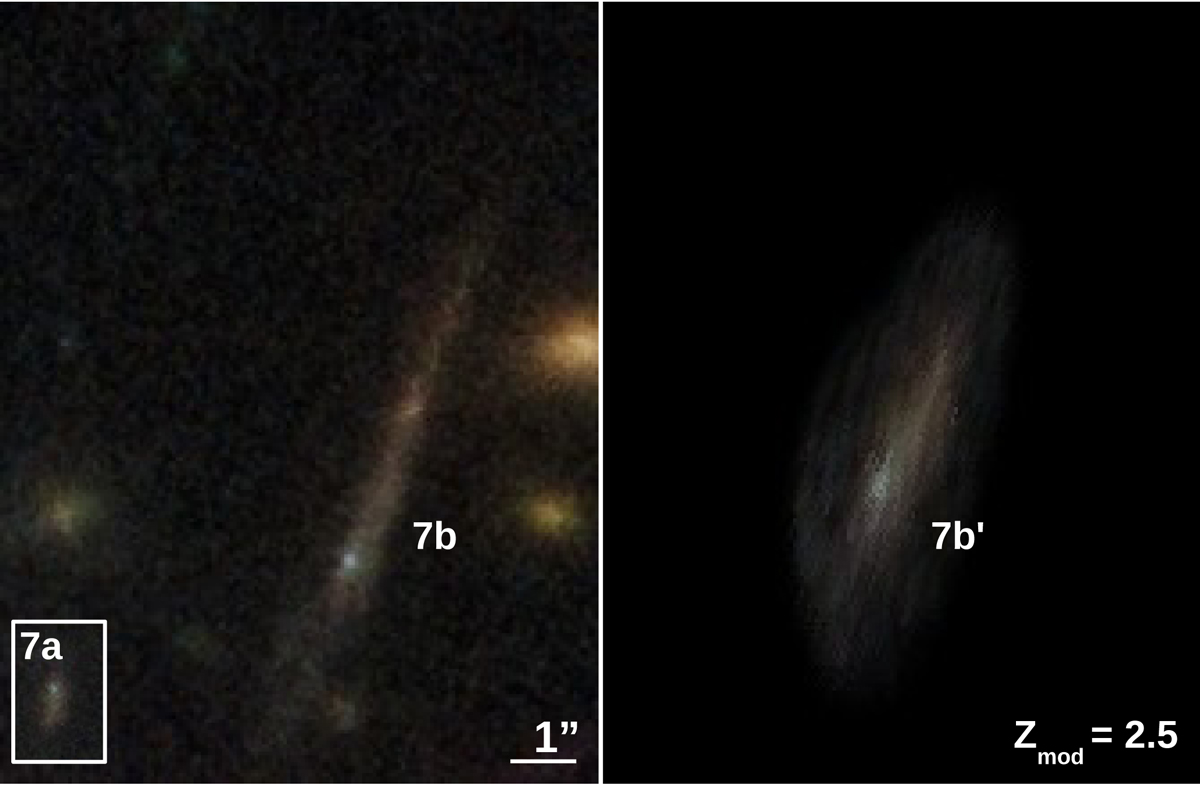
Prediction for new system 7. The left panel shows the observed arcs. Image 7a is used to predict the image 7b’ in the right panel. We note how the tangential magnification in 7b’ is smaller than in 7a, but the tangential one is larger.
Current usage metrics show cumulative count of Article Views (full-text article views including HTML views, PDF and ePub downloads, according to the available data) and Abstracts Views on Vision4Press platform.
Data correspond to usage on the plateform after 2015. The current usage metrics is available 48-96 hours after online publication and is updated daily on week days.
Initial download of the metrics may take a while.