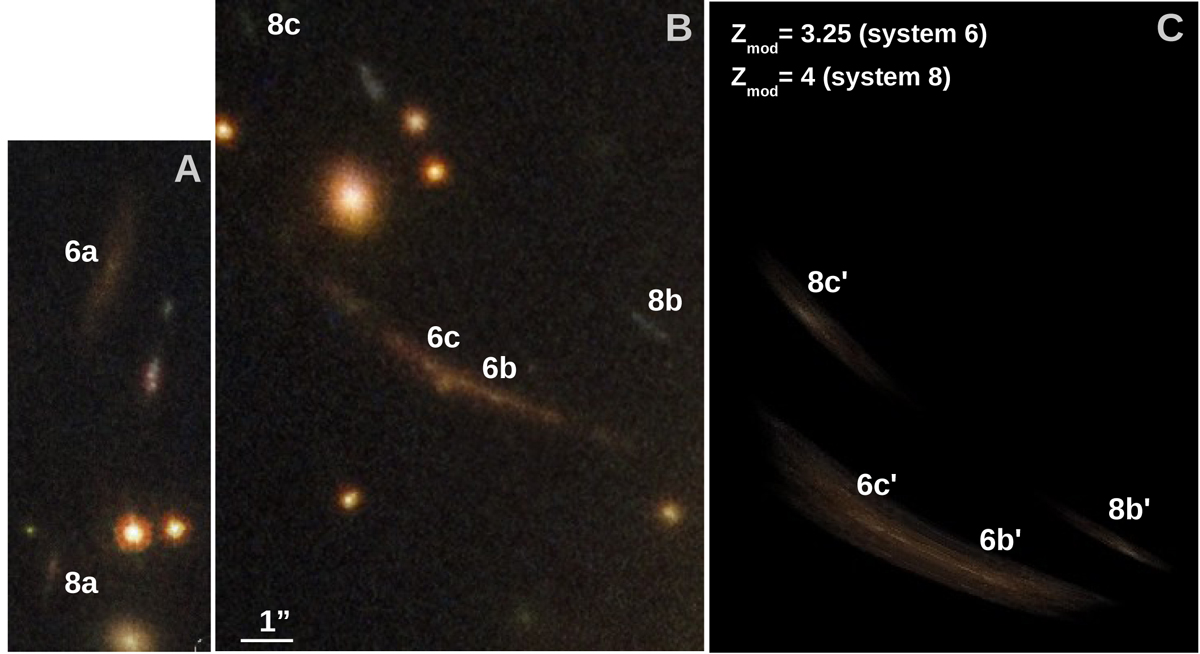
Fig. C.2.
Download original image
Prediction for new systems 6 and 8. The left panel (A) shows the images 6a and 8a used to predict the counterimages. The middle panel (B) shows the observed counterimages 6b, 6c, 8b, and 8c. The right panel (C) shows the predicted images 6b, 6c, 8b, and 8c. The coordinates, orientation and dimension of panels B and C are the same.
Current usage metrics show cumulative count of Article Views (full-text article views including HTML views, PDF and ePub downloads, according to the available data) and Abstracts Views on Vision4Press platform.
Data correspond to usage on the plateform after 2015. The current usage metrics is available 48-96 hours after online publication and is updated daily on week days.
Initial download of the metrics may take a while.