Fig. 9
Download original image
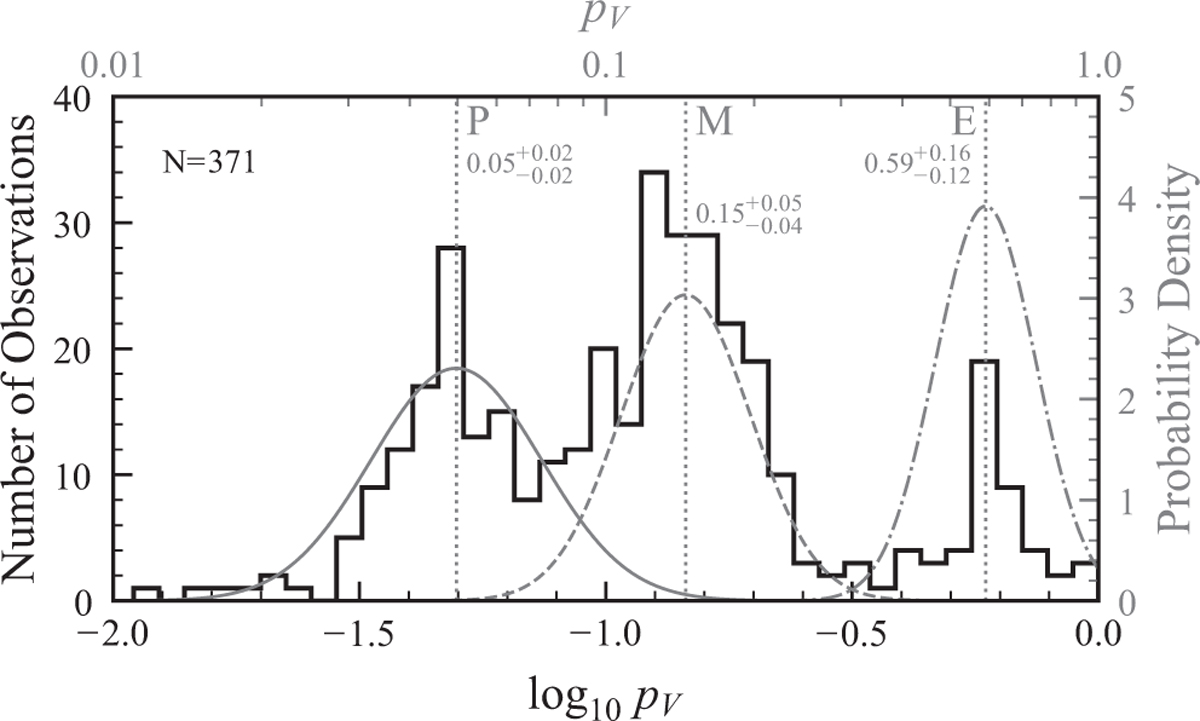
Distribution of visual albedos in clusters associated with the X-complex. The spectral degeneracy of the X-complex is resolved by fitting a three-component Gaussian mixture model to its albedo distribution, consisting of N observations and shown in the histogram. The fitted components are given by the solid, dashed, and dash-dotted grey lines in terms of the probability distribution. The vertical dotted lines give the mean values of components, labelled by the established class designations P, M, and E in order of ascending albedo. The numbers below the class labels give the mean pV and the upper and lower 1 σ limits per class. We note that these values slightly change later as other class members are added from clusters which are not assigned purely to the X-complex. The final albedo distributions are given in Table 3.
Current usage metrics show cumulative count of Article Views (full-text article views including HTML views, PDF and ePub downloads, according to the available data) and Abstracts Views on Vision4Press platform.
Data correspond to usage on the plateform after 2015. The current usage metrics is available 48-96 hours after online publication and is updated daily on week days.
Initial download of the metrics may take a while.