Fig. 4
Download original image
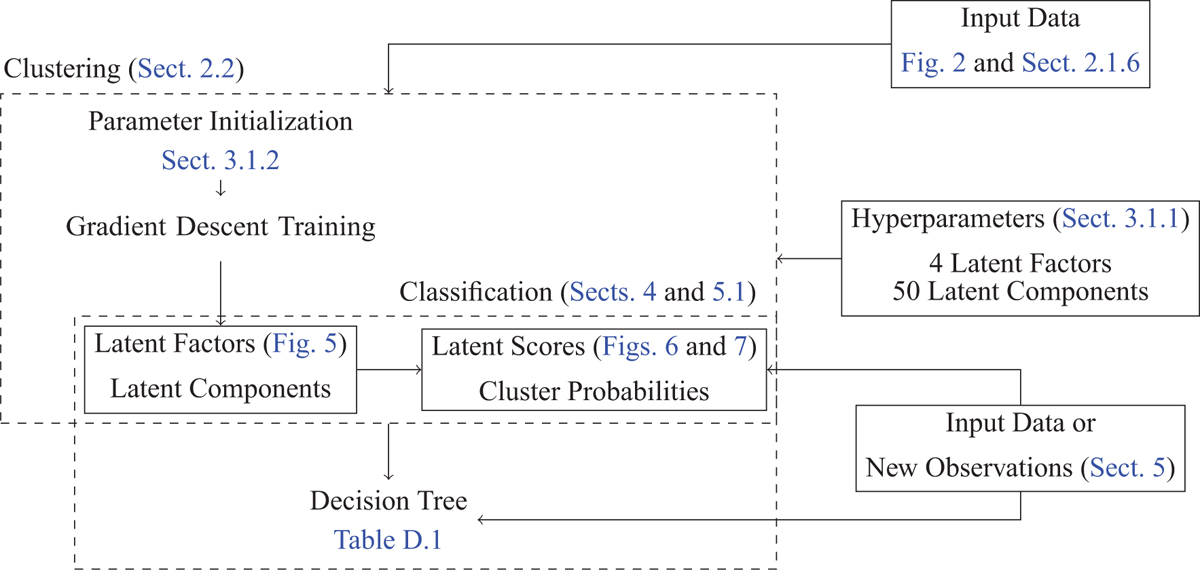
Overview of the clustering and classification of the input observations. The MCFA model encompassed in the upper dashed rectangle can be computed using the mcfa python package. The classification of the input data or new observations in the lower dashed rectangle can be done using the classy python package described in Sect. 5.
Current usage metrics show cumulative count of Article Views (full-text article views including HTML views, PDF and ePub downloads, according to the available data) and Abstracts Views on Vision4Press platform.
Data correspond to usage on the plateform after 2015. The current usage metrics is available 48-96 hours after online publication and is updated daily on week days.
Initial download of the metrics may take a while.