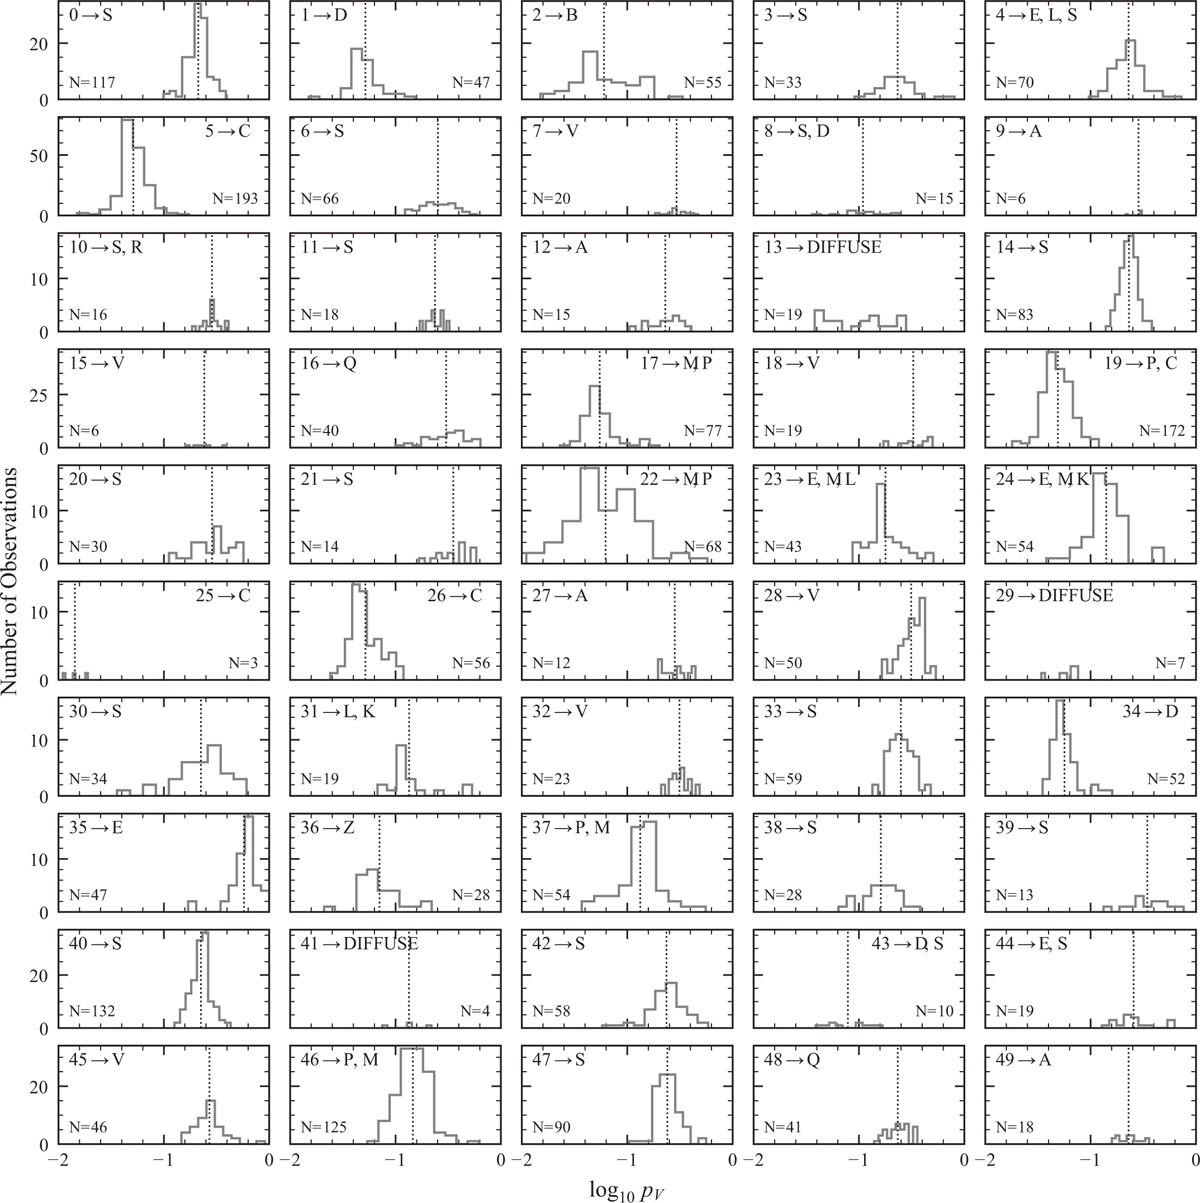
Fig. A.1
Download original image
Overview of the albedo distribution per cluster, including the number N of albedos and the asteroid classes to which the cluster contributes , excluding classes with fewer than three contributed observations except for cluster 25 which has only three observations. The classes are sorted by the total number of observations the cluster contributed. The dotted line gives the mean value of the albedos per cluster except for diffuse clusters and cluster 25. The y-axis limit is different in each row.
Current usage metrics show cumulative count of Article Views (full-text article views including HTML views, PDF and ePub downloads, according to the available data) and Abstracts Views on Vision4Press platform.
Data correspond to usage on the plateform after 2015. The current usage metrics is available 48-96 hours after online publication and is updated daily on week days.
Initial download of the metrics may take a while.