Fig. 20
Download original image
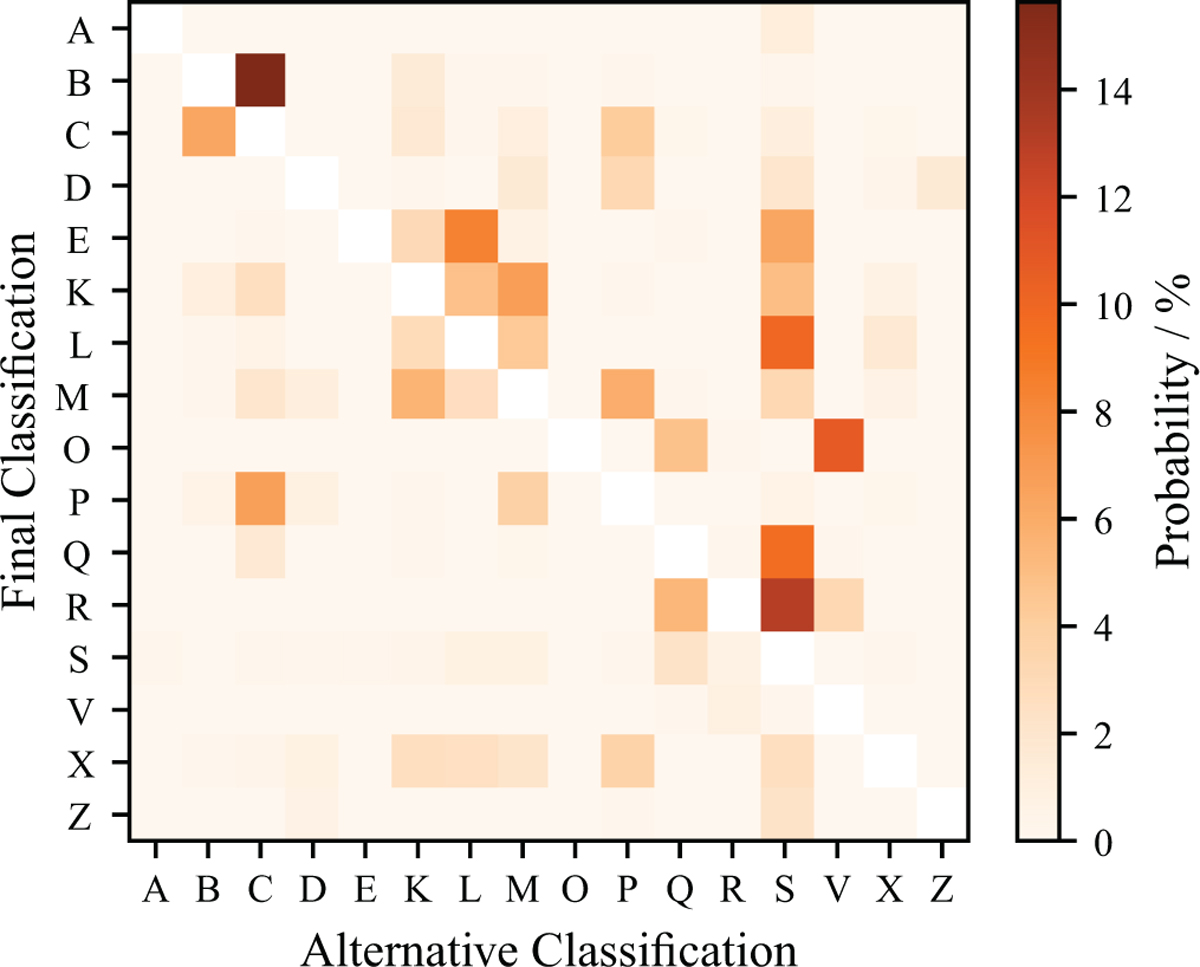
Confusion matrix between the classes defined in this taxonomy in the visible-near-infrared and albedo input space. For each class in the taxonomic scheme, we give the average probability of its samples to be classified as any other class based on the complete dataset. The Ch-class is missing as it relies on the detection of the 0.7 µm h-feature and does not have an associated class probability. For better readability, the main matrix diagonal corresponding to the equal-class cases is left empty. These values are generally above 80% and lowest for K, L, M, and R.
Current usage metrics show cumulative count of Article Views (full-text article views including HTML views, PDF and ePub downloads, according to the available data) and Abstracts Views on Vision4Press platform.
Data correspond to usage on the plateform after 2015. The current usage metrics is available 48-96 hours after online publication and is updated daily on week days.
Initial download of the metrics may take a while.