Fig. 2
Download original image
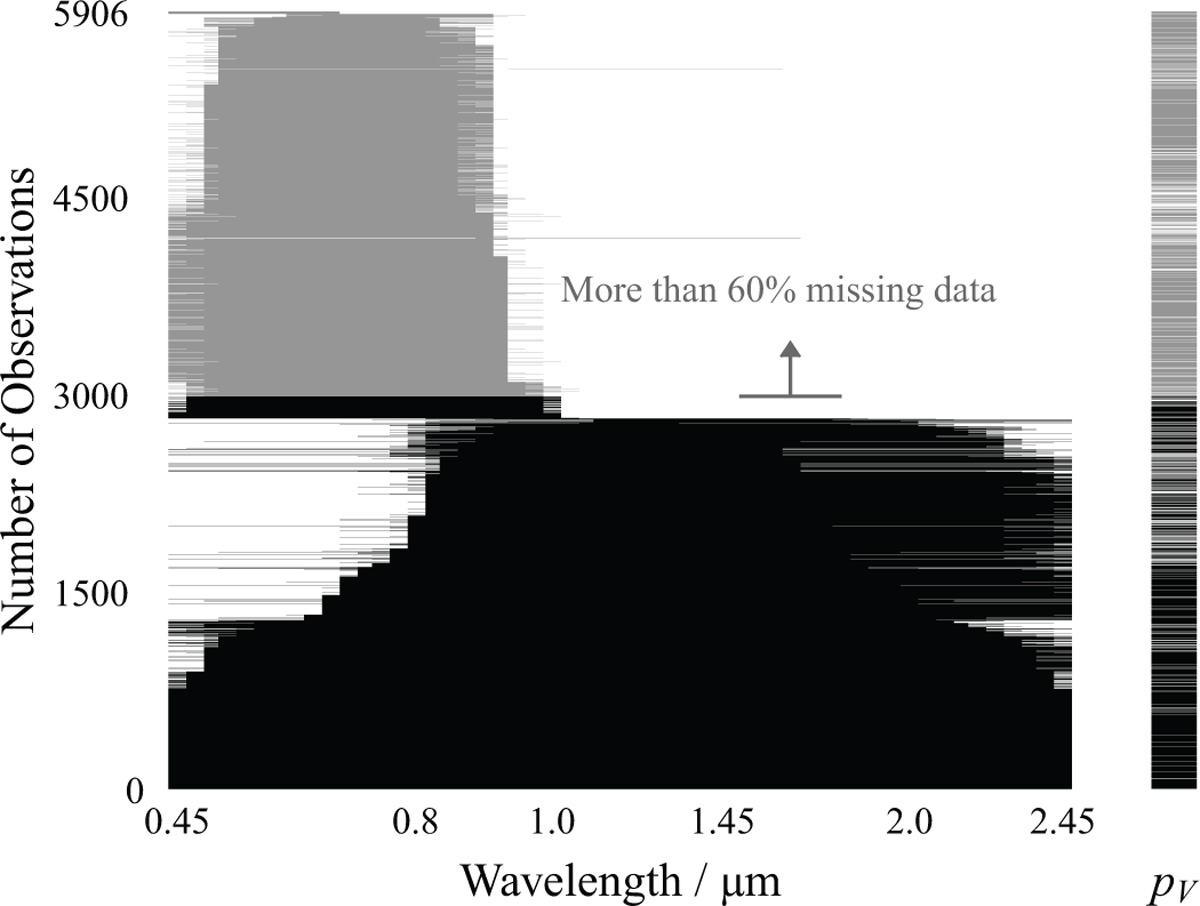
Input data shown as a matrix. The columns represent the asteroid observables (i.e. the spectral wavelength bins and the visual albedo pV) and each row represents one observation. The density of sampled wavelength bins is doubled in the visible compared to the near-infrared region. The cells are white if the corresponding value was not observed. The black cells indicate the samples used in the clustering analysis; the grey cells are samples that are classified but not used to build the taxonomy itself, due to the large degree of missing information in these spectra. 2983 observations are at least 40% complete and were used to train the clustering model. The matrix is sorted by increasing completeness of the asteroid spectra from top to bottom.
Current usage metrics show cumulative count of Article Views (full-text article views including HTML views, PDF and ePub downloads, according to the available data) and Abstracts Views on Vision4Press platform.
Data correspond to usage on the plateform after 2015. The current usage metrics is available 48-96 hours after online publication and is updated daily on week days.
Initial download of the metrics may take a while.