Fig. 12
Download original image
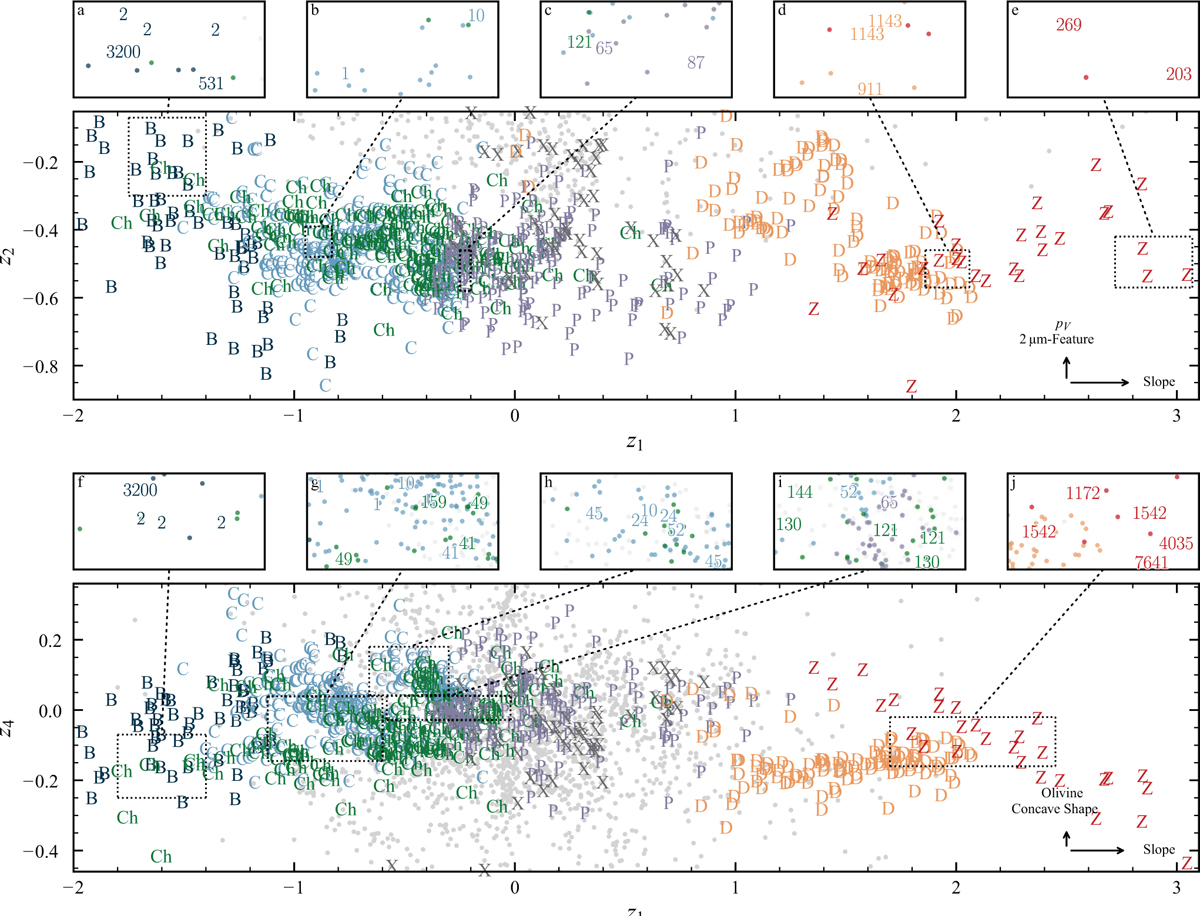
Distribution of C-complex and its endmember classes D and Z in the first latent component vs the second (top) and the fourth (bottom) latent components. The samples assigned to each class are given with the respective class letter. The latent scores of all samples outside these classes are shown as grey circles. Some outliers in z2 and z4 are not shown for readability. The five subpanels above each panel show regions of interest where a selection of asteroids are highlighted by replacing the symbol with the respective asteroid’s number. If more than one spectrum of the asteroid is in the input data, its number may appear several times.
Current usage metrics show cumulative count of Article Views (full-text article views including HTML views, PDF and ePub downloads, according to the available data) and Abstracts Views on Vision4Press platform.
Data correspond to usage on the plateform after 2015. The current usage metrics is available 48-96 hours after online publication and is updated daily on week days.
Initial download of the metrics may take a while.