Fig. 11
Download original image
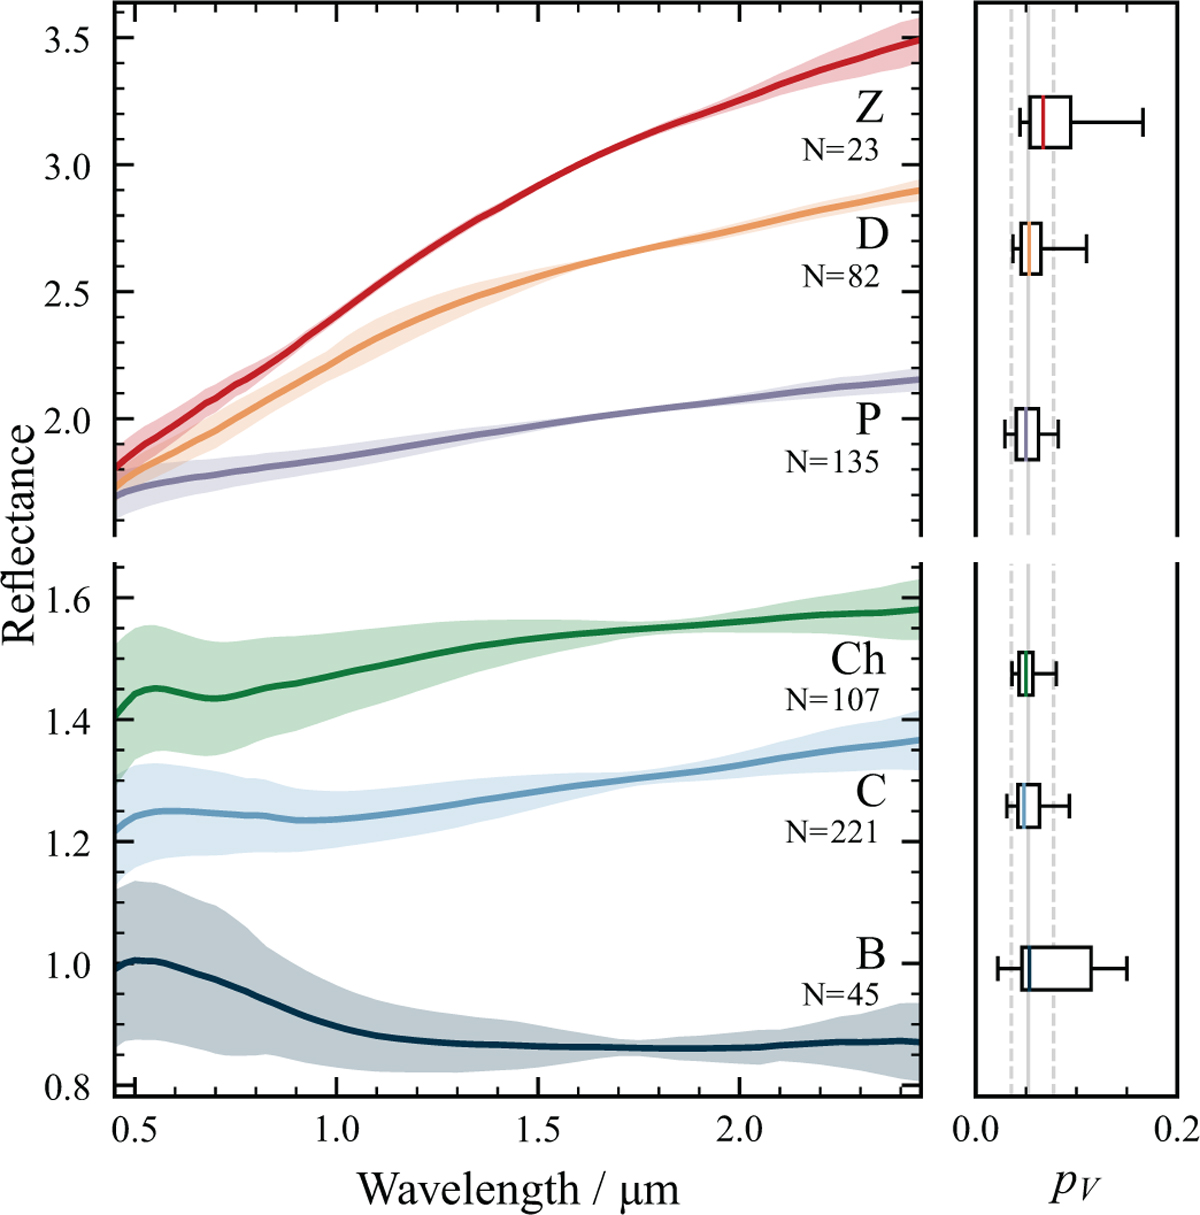
Mean (solid line) and standard deviation (shaded area) of the reflectance spectra for each class and endmember of the C-complex on the left hand side. The spectra are shifted along the y-axis for comparability. The reflectance scale changes between B, C, Ch and P, D, Z. The number N of individual asteroids assigned to each class is given below the class letter. On the right side are given the median (solid line), the lower and upper quartiles (box), and the 5th and 95th percentiles of the distribution of visual albedos within the class. The vertical grey lines give the mean albedo (solid) and the upper and lower standard deviation (dashed) within the whole complex. These latter values are ![]() for the C-complex.
for the C-complex.
Current usage metrics show cumulative count of Article Views (full-text article views including HTML views, PDF and ePub downloads, according to the available data) and Abstracts Views on Vision4Press platform.
Data correspond to usage on the plateform after 2015. The current usage metrics is available 48-96 hours after online publication and is updated daily on week days.
Initial download of the metrics may take a while.