Fig. 10
Download original image
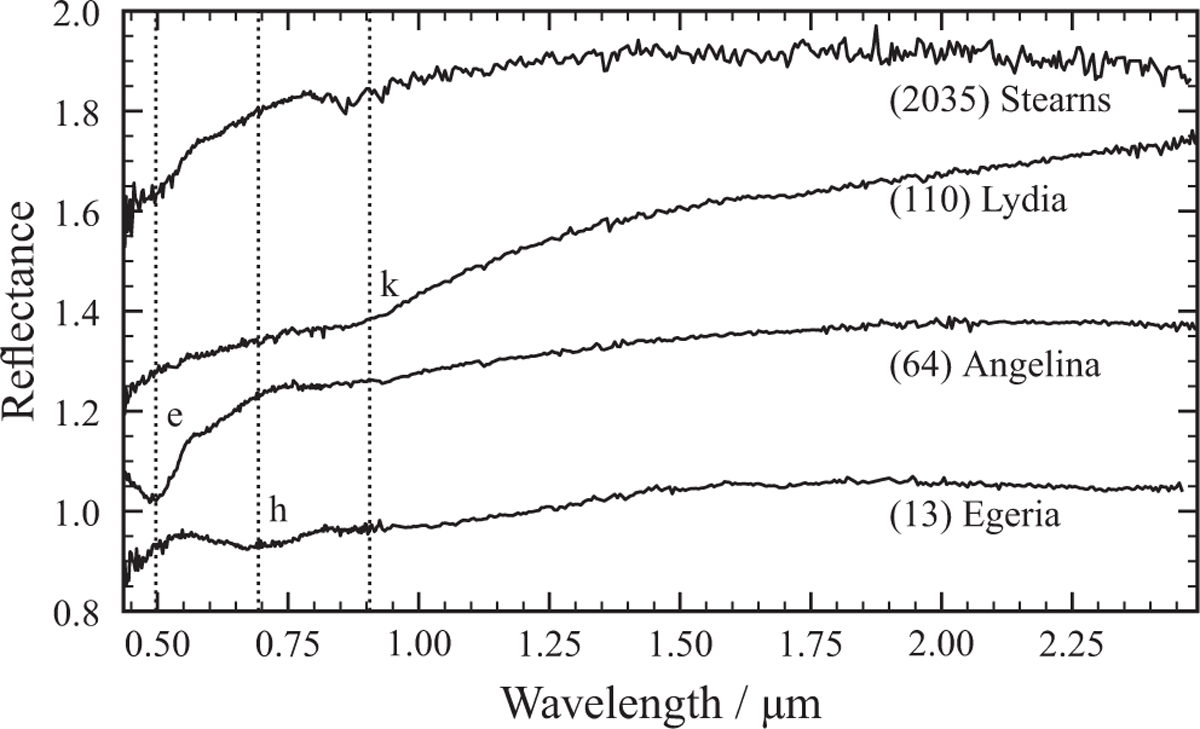
Example spectra carrying the e-, h-, or k-feature which are recognised in this taxonomic system. The mean band centres derived from all visually identified features in the spectral observations is indicated by the vertical dotted lines (e: 0.50 µm, h: 0.69 µm, k: 0.91 µm). (2035) Stearns exhibits both the e- and the k-feature. Data from SMASS (http://smass.mit.edu).
Current usage metrics show cumulative count of Article Views (full-text article views including HTML views, PDF and ePub downloads, according to the available data) and Abstracts Views on Vision4Press platform.
Data correspond to usage on the plateform after 2015. The current usage metrics is available 48-96 hours after online publication and is updated daily on week days.
Initial download of the metrics may take a while.