Fig. 6.
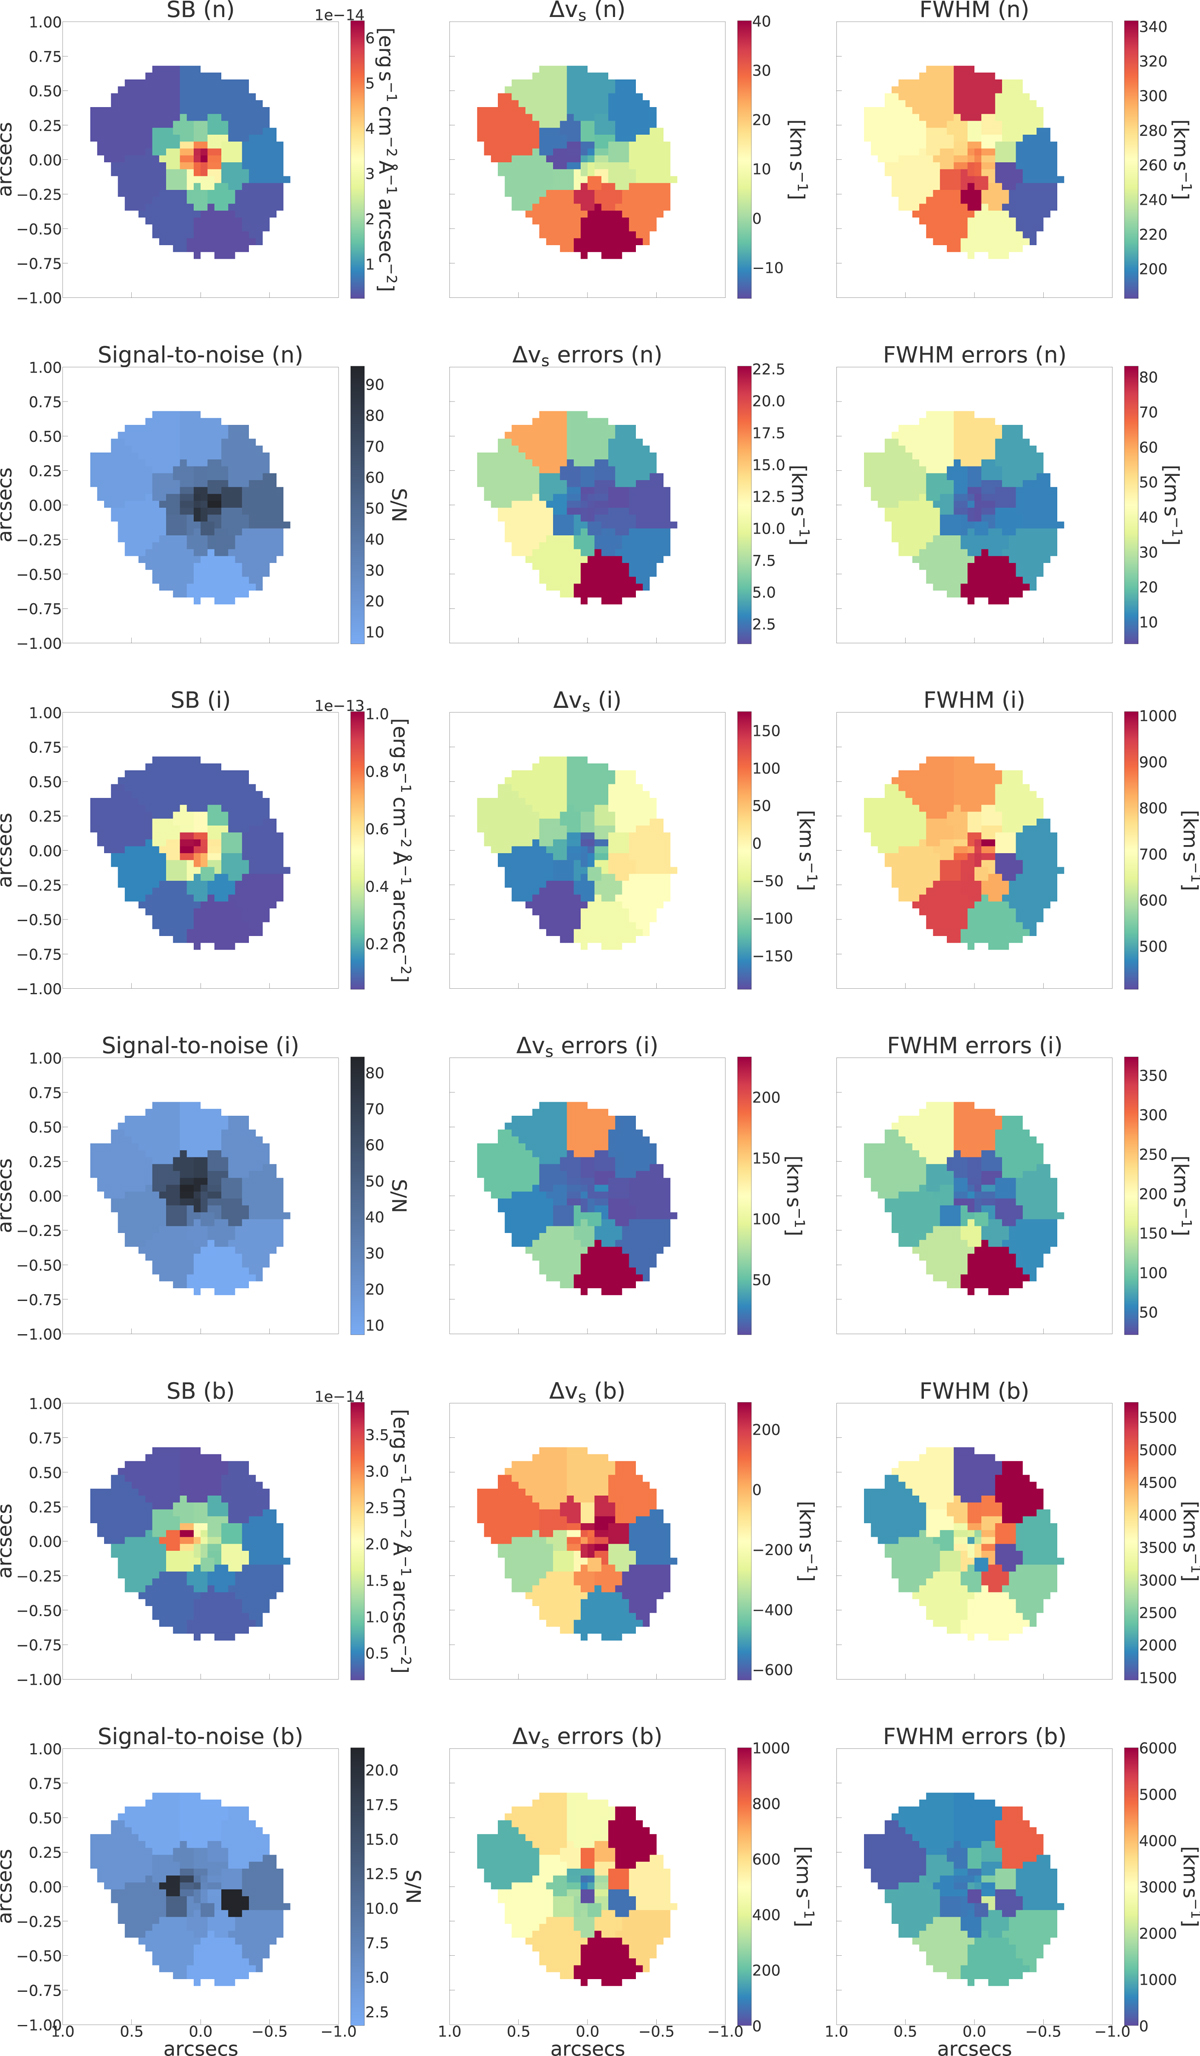
Download original image
Paα maps built after applying Voronoi tessellation. From top to bottom we show the emission line maps for the narrow (first two rows), intermediate (middle rows) and broad component (last two rows). For each component we show the surface brightness (SB), velocity shift (Δvs), and FWHM maps (from left to right), and underneath, the corresponding S/N and error maps. North is up and east to the left.
Current usage metrics show cumulative count of Article Views (full-text article views including HTML views, PDF and ePub downloads, according to the available data) and Abstracts Views on Vision4Press platform.
Data correspond to usage on the plateform after 2015. The current usage metrics is available 48-96 hours after online publication and is updated daily on week days.
Initial download of the metrics may take a while.