Fig. 5.
Download original image
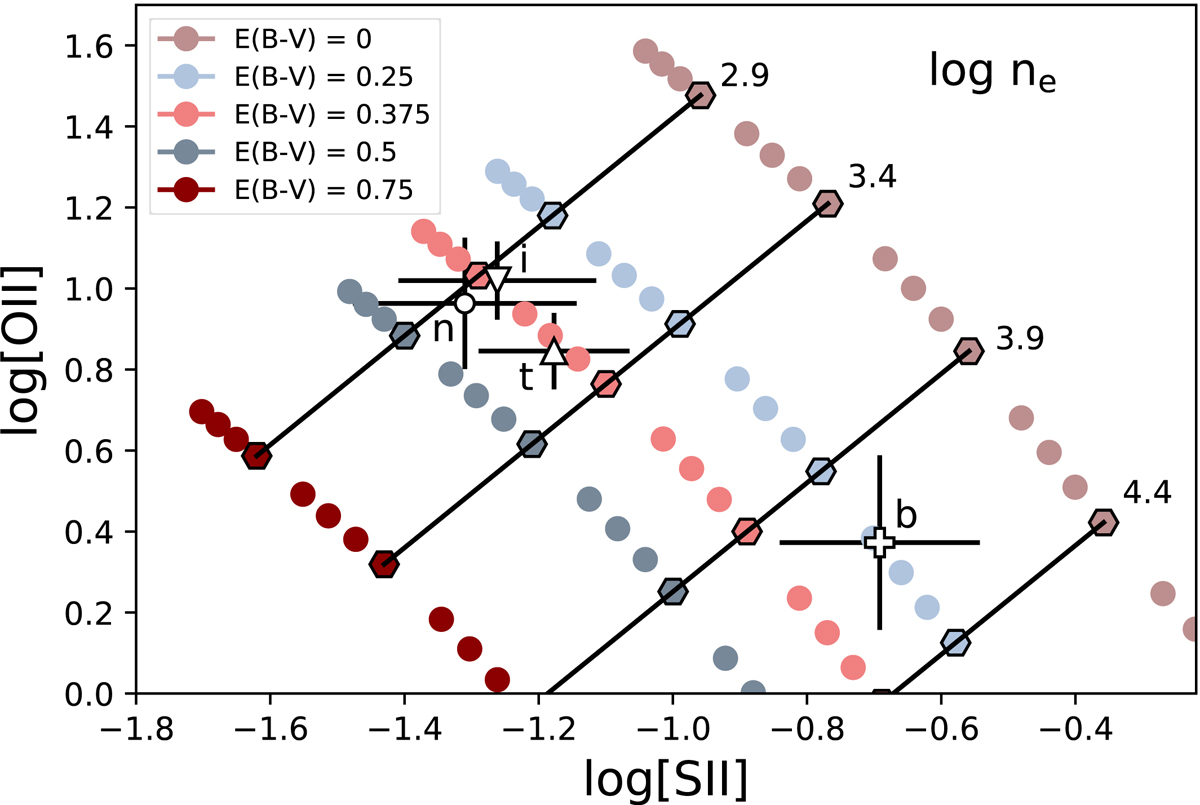
Diagnostic diagram from Rose et al. (2018) to simultaneously measure the reddening E(B − V) and ne of the ionized gas. The open symbols with error bars correspond to our flux measurements of the narrow (n), intermediate (i), total (t) and broad (b) components (circle, down- and up-pointing triangles, and plus symbol, respectively). Colour symbols correspond to the grid of photoionized models computed with Cloudy.
Current usage metrics show cumulative count of Article Views (full-text article views including HTML views, PDF and ePub downloads, according to the available data) and Abstracts Views on Vision4Press platform.
Data correspond to usage on the plateform after 2015. The current usage metrics is available 48-96 hours after online publication and is updated daily on week days.
Initial download of the metrics may take a while.