Fig. 3.
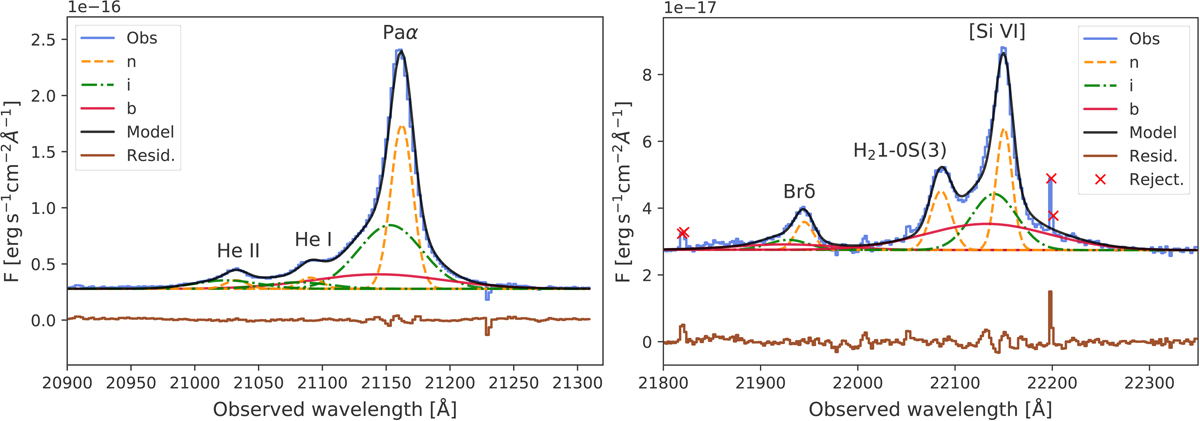
Download original image
Examples of fits of low, high ionization, and H2 lines detected in the nuclear spectrum, extracted with an aperture of 0.3″. The observed spectra are shown in blue, the model including all the components in black, and the residuals from the fit in brown. Left panel: Paα profile modelled using three Gaussians corresponding to a narrow (n), intermediate (i) and broad (b) component (orange dashed, green dot-dashed and red solid line respectively). He I and He II are detected in the blue wing of Paα, which are fitted with a narrow and intermediate components. Right panel: Brδ and [Si VI] are fitted with the same kinematic components as Paα. The profile of H21-0S(3) is well reproduced with just one Gaussian. Red crosses correspond to points removed from the fit of the profiles.
Current usage metrics show cumulative count of Article Views (full-text article views including HTML views, PDF and ePub downloads, according to the available data) and Abstracts Views on Vision4Press platform.
Data correspond to usage on the plateform after 2015. The current usage metrics is available 48-96 hours after online publication and is updated daily on week days.
Initial download of the metrics may take a while.