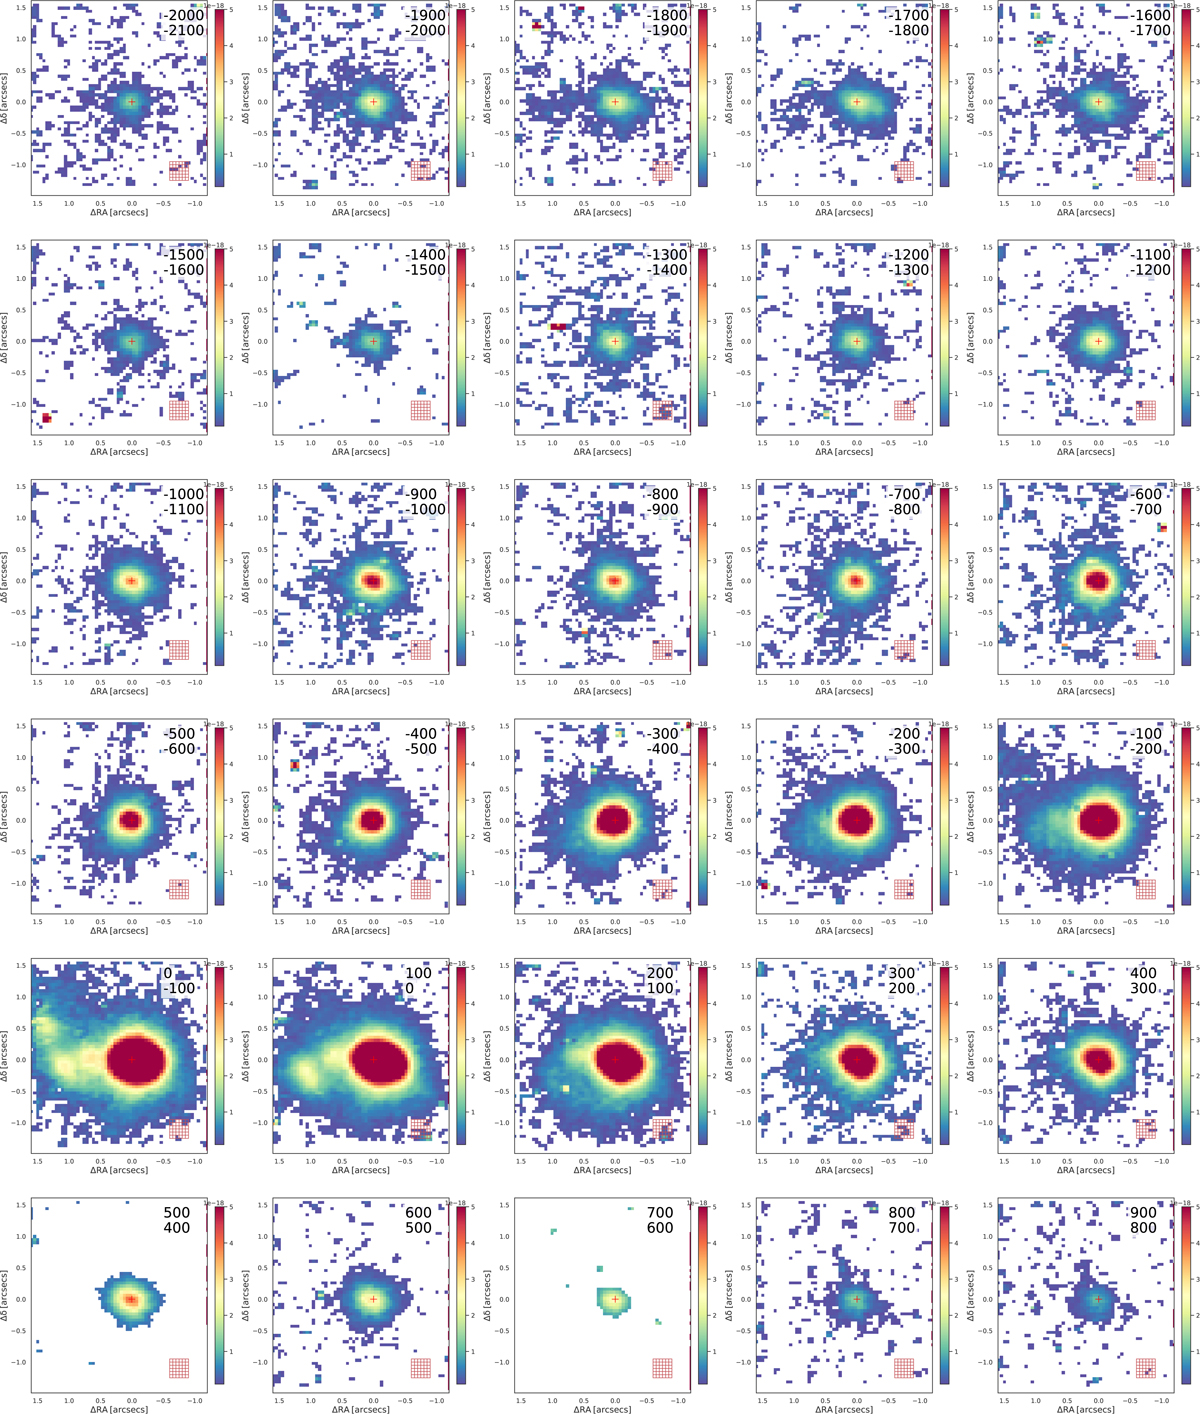
Fig. C.1.
Download original image
Continuum-subtracted Paα flux maps extracted in consecutive velocity steps of 100 km s−1. We measure the standard deviation from the red square box at the bottom right corner of each panel, and we use that to show only emission above 3σ. The velocity interval used to construct the maps is indicated in the top right corner of each panel, in km s−1. The peak of the nuclear Paα emission is indicated with a red cross.
Current usage metrics show cumulative count of Article Views (full-text article views including HTML views, PDF and ePub downloads, according to the available data) and Abstracts Views on Vision4Press platform.
Data correspond to usage on the plateform after 2015. The current usage metrics is available 48-96 hours after online publication and is updated daily on week days.
Initial download of the metrics may take a while.