Fig. 13.
Download original image
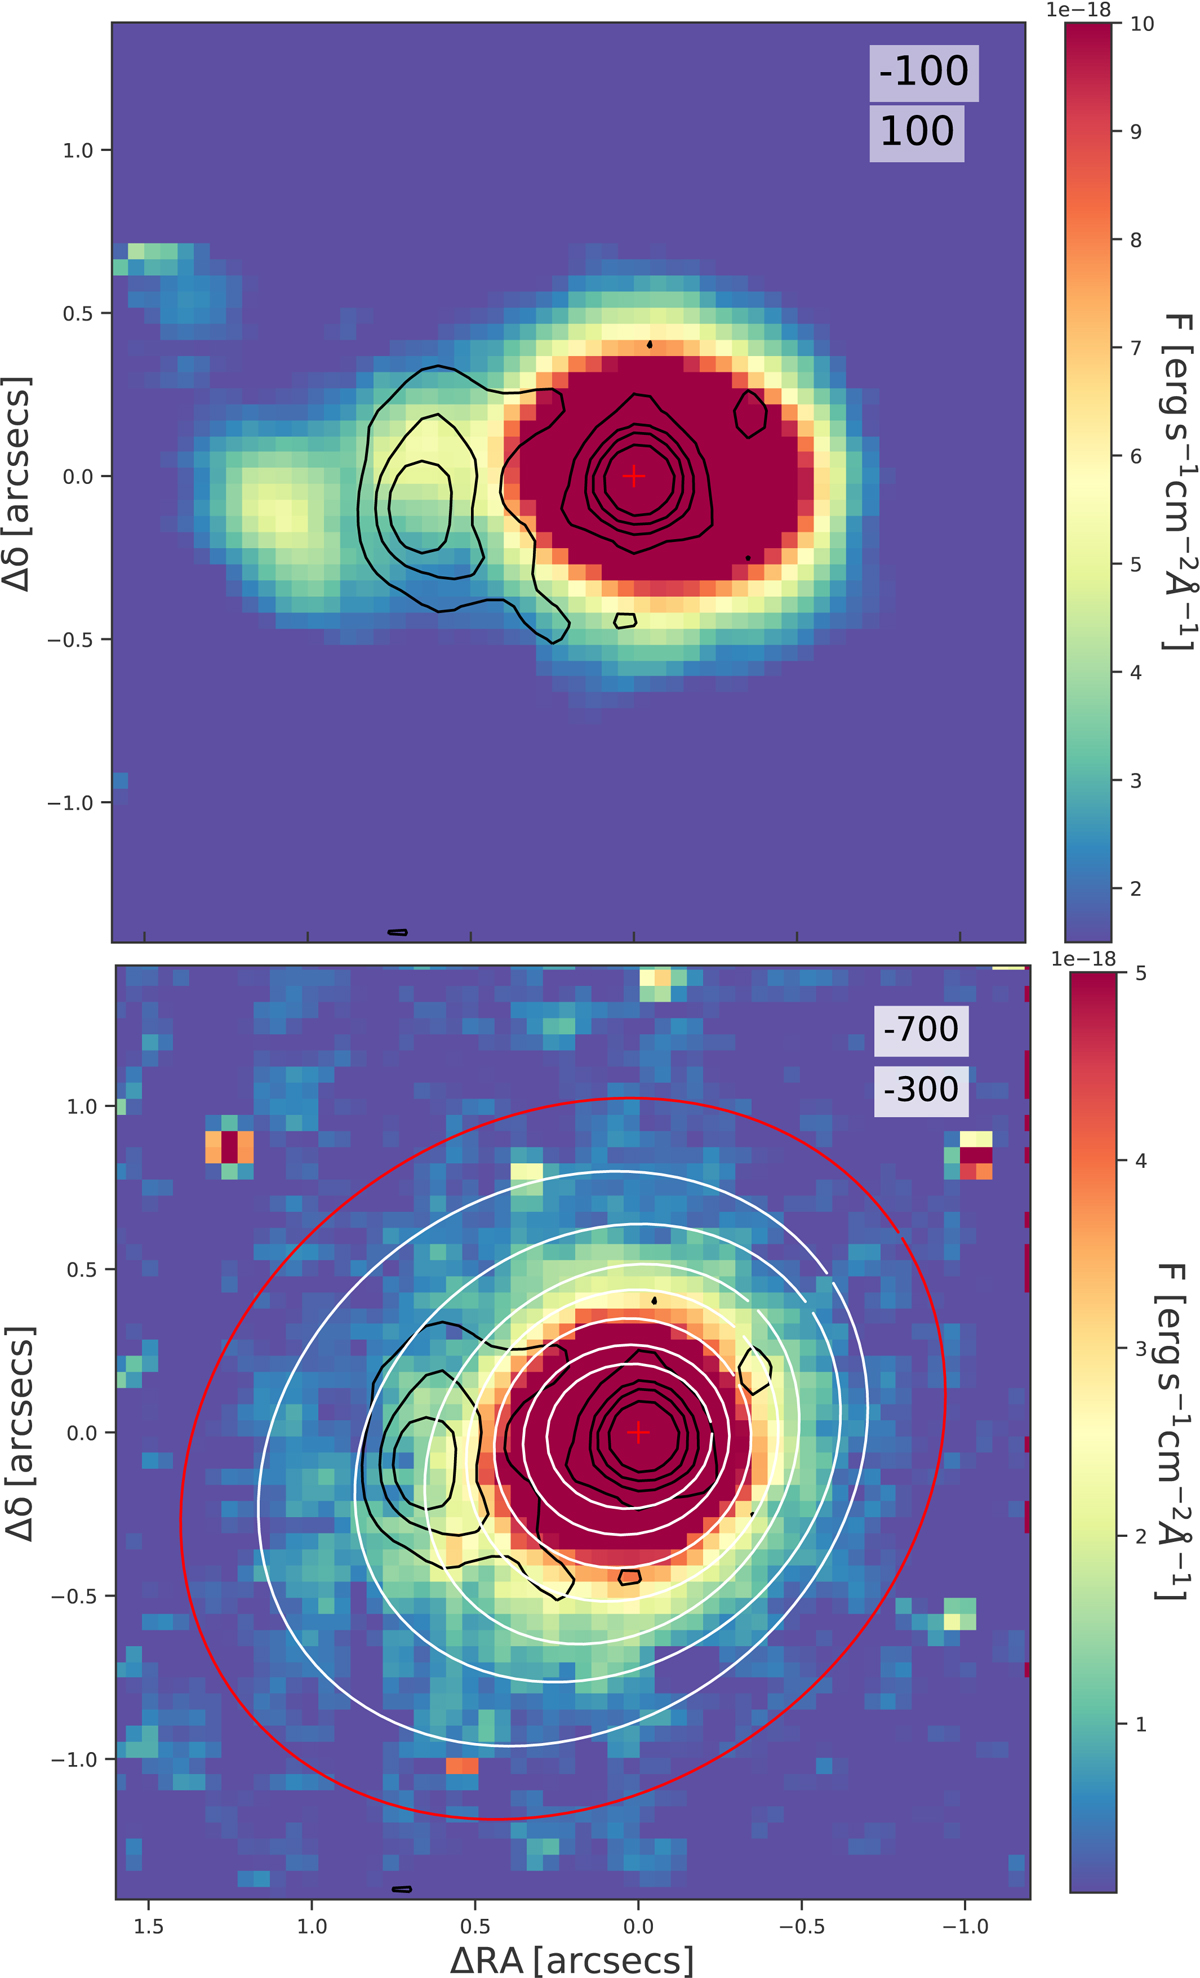
Flux maps of the Paα emission with contours at 3, 15, 30, 60 σ of the radio VLA 6 GHz high resolution (∼0.25 arcsec beam) image superimposed (black contours). Top panel: systemic Paα emission between −100 and 100 km s−1. Bottom panel: flux map of the Paα emission between −700 and −300 km s−1with the fitted ellipses, at different distances from the central peak, in white and the ellipse used to measure the outflow extent in red.
Current usage metrics show cumulative count of Article Views (full-text article views including HTML views, PDF and ePub downloads, according to the available data) and Abstracts Views on Vision4Press platform.
Data correspond to usage on the plateform after 2015. The current usage metrics is available 48-96 hours after online publication and is updated daily on week days.
Initial download of the metrics may take a while.