Fig. 12.
Download original image
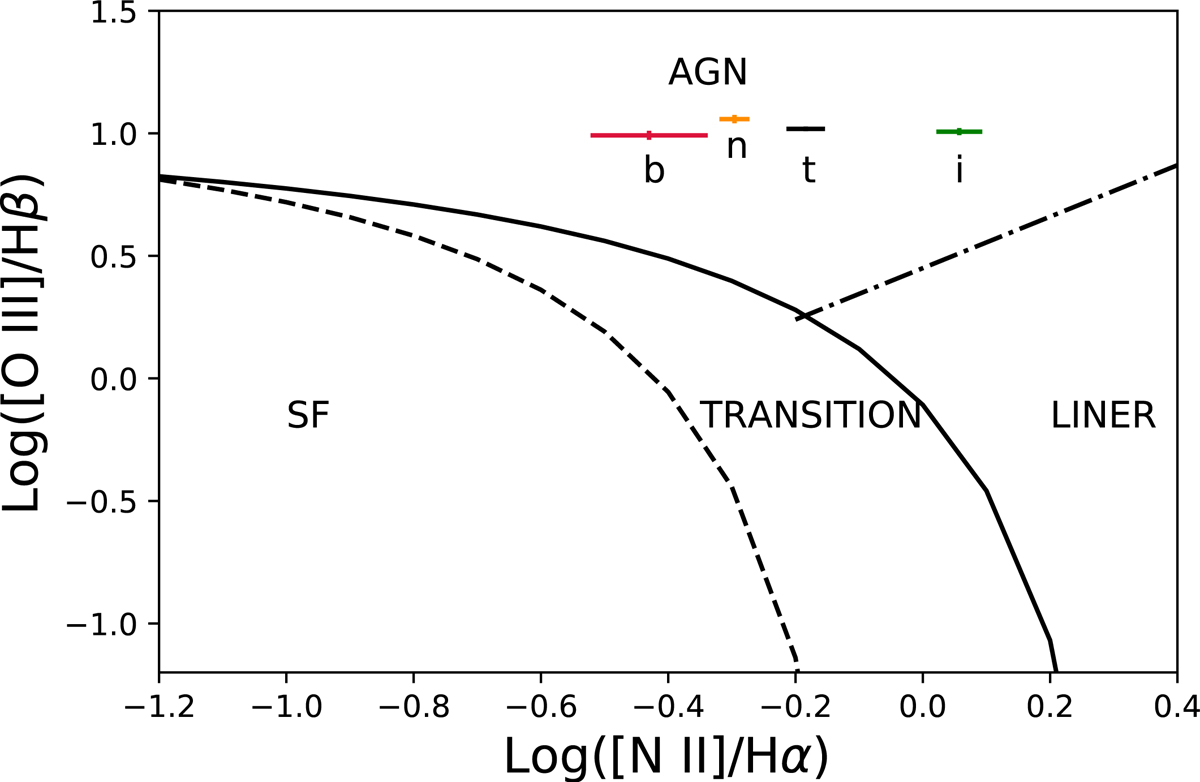
Diagnostic diagrams for each component fitted from the SDSS spectrum of J0945, where the colour code for the components is the same as in Fig. 3. The lines separating AGN, transition objects, LINERs, and star-forming galaxies are from Kewley et al. (2001; solid curve), and Kauffmann et al. (2003; dashed curve), and Kewley et al. (2006; dash-dotted curve). Error bars have been calculated from a series of 100 Monte Carlo simulations.
Current usage metrics show cumulative count of Article Views (full-text article views including HTML views, PDF and ePub downloads, according to the available data) and Abstracts Views on Vision4Press platform.
Data correspond to usage on the plateform after 2015. The current usage metrics is available 48-96 hours after online publication and is updated daily on week days.
Initial download of the metrics may take a while.