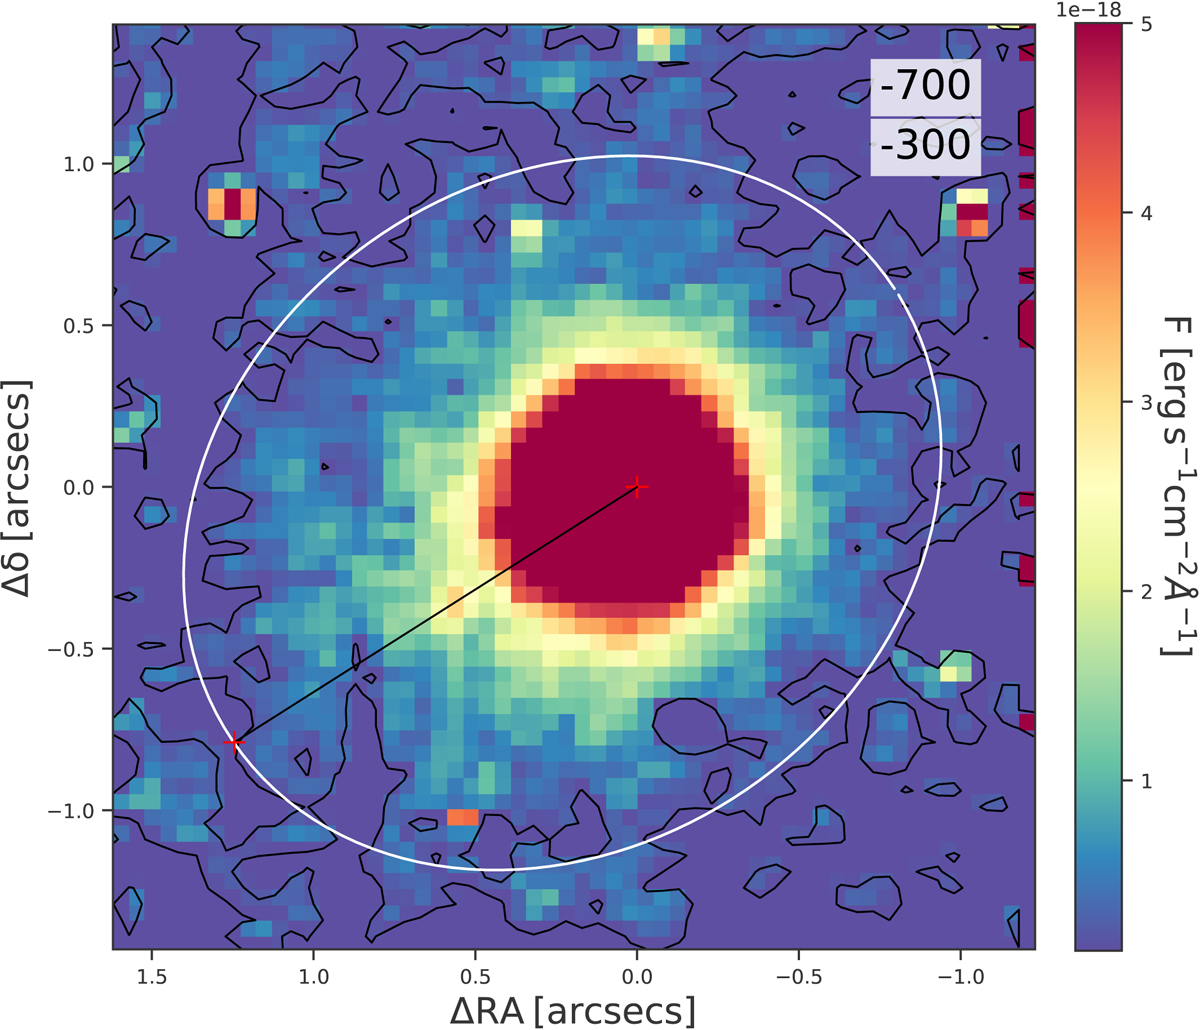
Fig. 10.
Download original image
Continuum-subtracted Paα flux map of J0945 extracted in the velocity interval between −700 and −300 km s−1 from the NIR data cube. The white ellipse defines the region that encompasses the bulk of the emission above 3σ (black contours). The two red crosses are the Paα emission peak and the most distant point from it on the ellipse. We consider the distance between crosses (black straight line) as the maximum extension of the outflow (Rout).
Current usage metrics show cumulative count of Article Views (full-text article views including HTML views, PDF and ePub downloads, according to the available data) and Abstracts Views on Vision4Press platform.
Data correspond to usage on the plateform after 2015. The current usage metrics is available 48-96 hours after online publication and is updated daily on week days.
Initial download of the metrics may take a while.