| Issue |
A&A
Volume 665, September 2022
|
|
|---|---|---|
| Article Number | A44 | |
| Number of page(s) | 9 | |
| Section | Cosmology (including clusters of galaxies) | |
| DOI | https://doi.org/10.1051/0004-6361/202243542 | |
| Published online | 07 September 2022 | |
How galaxies populate halos in extreme density environments: An analysis of the halo occupation distribution in SDSS
1
Instituto de Astronomía Teórica y Experimental, CONICET-UNC, Laprida 854, X5000BGR Córdoba, Argentina
e-mail: This email address is being protected from spambots. You need JavaScript enabled to view it.
2
Observatorio Astronómico de Córdoba, UNC, Laprida 854, X5000BGR Córdoba, Argentina
Received:
14
March
2022
Accepted:
31
May
2022
Abstract
Context. Recent works have shown that the properties of galaxy populations in simulated dark matter halos vary with large-scale environments. These results suggest a variation in the halo occupation distribution (HOD) in extreme density environments since the dynamical and astrophysical conditions prevailing in these regions may significantly affect the formation and evolution of their halos and residing galaxies, influencing the mean number of satellite galaxies. To analyze these effects, we identify cosmic voids and future virialized structures (FVSs) in the Sloan Digital Sky Server Data Release 12 (SDSS-DR12) and estimate the HOD within these super-structures using group catalogs as dark matter halo proxies.
Aims. Our goal is to use observational galaxy data to characterize the HOD within cosmic voids and FVSs, explore the different properties of these galaxies’ populations, and compare them with the general results outside of these super-structures.
Methods. We used a publicly available observational galaxy catalog with information on redshifts, positions, magnitudes, and other astrophysical features to build a volume complete galaxy sample and identify cosmic voids and FVSs. Using a publicly available galaxy group catalog as a proxy to dark matter halos, we computed the HOD within both types of super-structures for different absolute magnitude thresholds. We also studied the dependence of the results on the main void and FVS properties, density, and volume. We also analyzed the main characteristics of the stellar content of galaxies inside these extreme-density regions such as the mean stellar age and the stellar mass. In all cases, we compared the results with those derived from the field sample, defined by objects outside of both types of environments.
Results. Inside cosmic voids, we find a strong decrease in the HOD concerning the field results. In the most extreme cases, that is to say groups with masses above ∼1013 h−1 M⊙, the mean number of satellites fall to ∼50%. Inside FVSs, the HOD shows a significant increase to the field, with a ∼40% excess in the mean number of satellites for groups with masses around 1014 h−1 M⊙. These results are present for the different galaxy luminosity ranges explored. In both environments, the differences with respect to the field increases for the extreme values of the density environments. However, we obtain no signs of variations related to intrinsic characteristics of the super-structures, indicating that the effects mainly depend on the density of the large-scale environment. In addition, we find that the cumulative distribution of the mean age of stars of the central galaxy also varies in the different regions; this suggests that the history of the formation of the dark matter halos may be different. Finally, we explore the HOD for the 25% youngest (oldest) galaxies, based on the mean age of their stars. We find that for the low-mass groups the youngest galaxies are only present inside voids, and they are generally central galaxies. On the other hand, for the high-mass groups, the FVS environments show the same increase in the HOD concerning the field as previously mentioned. We find that cosmic voids lack a significant fraction of galaxies with the oldest stellar population.
Key words: large-scale structure of Universe / Galaxy: halo / galaxies: statistics / methods: data analysis / methods: statistical
© I. G. Alfaro et al. 2022
 Open Access article, published by EDP Sciences, under the terms of the Creative Commons Attribution License (https://creativecommons.org/licenses/by/4.0), which permits unrestricted use, distribution, and reproduction in any medium, provided the original work is properly cited.
This article is published in open access under the Subscribe-to-Open model. This email address is being protected from spambots. You need JavaScript enabled to view it. to support open access publication.
1. Introduction
The current paradigm of structure formation in the Universe predicts that galaxies form within virialized dark matter halos as a product of accretion of baryonic material. However, the variety of complex astrophysical phenomena involved in the galaxy formation and evolution process makes it difficult to determine, unambiguously, how galaxies populate a given halo. Understanding this relationship is key to understanding the formation and evolution of large-scale structures, as well as its influence on the properties of galaxies.
A valuable statistical tool to study the connection between galaxies and their dark matter halos is the halo occupation distribution (HOD). The HOD is defined as the probability distribution that a virialized halo of mass Mhalo contains N galaxies with specific characteristics, P(N|Mhalo). It is generally assumed that, at first order, the HOD only depends on the mass of the halo (e.g., Jing et al. 1998; Ma & Fry 2000; Peacock & Smith 2000; Seljak 2000; Scoccimarro et al. 2001; Berlind & Weinberg 2002; Cooray & Sheth 2002; Berlind et al. 2003; Zheng et al. 2005; Yang et al. 2007; Rodriguez et al. 2015; Rodriguez & Merchán 2020). However, recent works on simulations have shown a correlation between the HOD and the density of the environment in which the halos evolve (e.g., Zehavi et al. 2018; Artale et al. 2018; Bose et al. 2019). This led to the study of the HOD behavior within regions with extreme density values, such as cosmic voids (Alfaro et al. 2020) and future virialized structures (FVSs, Alfaro et al. 2021).
The large-scale structure of the Universe, usually called the cosmic web, is the result of mass accretion, a process mainly dominated by gravity. As is well known, this gives rise to regions where the density of matter reaches extreme values concerning the average density. The cosmic voids correspond to the regions with the lowest density, while the FVSs correspond to those with the highest density. Although there are many definitions for a void, most agree that these regions comprise most of the volume of the Universe and that they contain a small fraction of galaxies, which – added to their expanding dynamics – make gravitational interactions between objects infrequent within them, affecting the growth and development of the structure (Ceccarelli et al. 2006; Patiri et al. 2006; Colberg et al. 2008; Pan et al. 2012; Hoyle et al. 2012; Ruiz et al. 2015, 2019). On the other hand, it is well known that mass flows from less dense regions to denser ones, mainly through filaments and walls. At the intersections of these two structures, nodes can form, which under certain conditions can evolve into the densest virialized regions of the Universe, called FVSs. Observationally, the properties of galaxies and groups in these extremely dense environments, which also contain most of the high-mass halos, suggest that galaxy groups may have formed earlier in these super-structures than in the middle regions of the Universe (Einasto et al. 1997, 2001, 2007; Dünner et al. 2006; Costa-Duarte et al. 2010; Luparello et al. 2011; Liivamägi et al. 2012).
In Alfaro et al. (2020, 2021), we found evidence of significant variations in the HOD within voids and FVSs, respectively. For this, we used both semi-analytical and hydrodynamical simulations. We found that there is a correlation between the age of halo formation, the average number of galaxies in a halo, and the environment in which they are located. The halos within the voids had a lower than average HOD and formed at a lower than average redshift. Whereas, within the FVSs, the halos had a higher than average HOD and formed at a higher redshift. This is indicative, as observed in the synthetic data, that the halos in these regions have evolutionary histories different from the average, which affects how galaxies populate them. The methods with which we identified voids and FVSs are fully reproducible observationally.
Taking advantage of the large data volume provided by the Sloan Digital Sky Survey Data Release 12 (SDSS-DR12, Alam et al. 2015), in this work, we set out to explore the HOD in extreme density environments to assess whether the results obtained theoretically correspond to those from observations. To meet this objective, we also used the SDSS-DR12 group catalog developed by Rodriguez & Merchán (2020) and the possibility to identify extreme environments of the large-scale structure through our algorithms. Voids were identified with the algorithm of Ruiz et al. (2015), while FVSs were detected following Luparello et al. (2011).
This paper is organized as follows. In Sect. 2, we describe the observational galaxy catalog and the sample of objects used in this work. We also characterized the galaxy groups’ catalog and the algorithms to identify cosmic voids and FVSs. In Sect. 3, we show the main properties of our super-structures’ catalogs. In Sect. 4, we describe the method we used to estimate the HOD and define the three samples of galaxy groups that we analyzed: groups in voids, FVSs, and the field. We present and compare the results of the HOD measurements for these three different regions. We also explore the dependence of the results with the density of the environment surrounding the group and with the intrinsic properties of the super-structures in Sect. 4. In Sect. 5, we compare the onset time of star formation of the central galaxies inside the voids and FVSs with the field results. Based on this measure of time, we also computed the HOD for ∼25% of the youngest and oldest galaxies. Finally, in Sect. 6, we present our summary and conclusions.
2. Data
In this section, we describe the galaxy catalog, the galaxy group finder with its dark matter halo mass estimation, and the voids and FVS identification algorithms used in this work.
2.1. The SDSS galaxy catalog
We use the main galaxy sample of SDSS-DR12 (Alam et al. 2015). This Legacy footprint area covers more than 8400 deg2 in five optical bandpasses and has more than ∼800 000 million galaxies with a redshift up to z = 0.3 and apparent magnitudes in the r band lower than 17.77. In addition to the redshift, position, and magnitudes, we employed the astrophysical data from the Portsmouth method with the star formation model to the galaxies and stellar masses estimated following the Maraston et al. (2006) method. This estimation fits stellar evolution models to SDSS photometry, using the Baryon Oscillation Spectroscopic Survey (BOSS) redshifts. The star formation model considers metallicity and three star-formation histories, constant, truncated, and exponentially declining (τ), which is provided in the “SFH” column. The “age” parameter listed gives the initial time for the onset of star formation in each model. In this table, we assume the Kroupa initial mass function1. From this sample, we selected galaxies with a limiting redshift, zlim = 0.1, and a limiting r-band absolute magnitude of Mr − 5log10(h) = − 19.77. Thus, our sample is complete in volume providing accurate tracer galaxies to identify suitable super-structures, that is to say voids and FVSs.
2.2. The group galaxy catalog
To compute the HOD, in addition to the photometric data of the galaxies, we need to associate galaxies with the dark matter halos they inhabit and determine the masses of these halos. For this purpose, we used the catalog of galaxy groups presented by Rodriguez & Merchán (2020). This group sample was obtained by a new iterative algorithm that combines the friends-of-friends (Merchán & Zandivarez 2005) and halo-based (Yang et al. 2007) techniques. If the group members vary, the method recalculates the dark matter halo properties, repeating the process until no more changes in the groups are needed. This approach allows one to maintain a high performance, both to detect low and high numbers of members systems. As part of the process, this procedure provides a halo mass estimation for each group, Mgroup, which is obtained by an abundance matching technique based on luminosity, that is assuming a one-to-one relationship between the characteristic luminosity of the group and the halo mass (Vale & Ostriker 2004; Kravtsov et al. 2004; Conroy et al. 2006; Behroozi et al. 2010).
Among other advantages, it was found that this galaxy group sample presents excellent agreement between the mass it provides and those obtained by weak gravitational lensing techniques (Gonzalez et al. 2021). In addition, it was highly efficient at comparing properties of central and satellite galaxies with the results obtained in simulations (Rodriguez et al. 2021). Our final galaxy catalog is a volume-limited sample of galaxies up to z = 0.1, comprising 134 405 objects with angular positions, spectroscopic magnitudes, and other astrophysical data, together with their corresponding group and halo host membership and mass.
2.3. Voids identification
We used the algorithm presented in Ruiz et al. (2015) to identify spherical cosmic voids in the SDSS-DR12 main galaxy sample described in Sect. 2.1. Using galaxies as density tracers, we measured the integrated density contrast profile (Δ) in all underdense regions and we identified the largest sphere satisfying Δ(Rvoid) < Δlim, with Rvoid being the void radius and Δlim being an integrated density contrast threshold set to −0.9. In other words, our voids contain 10% of the mean density of tracers. All spheres that satisfy this condition were then cleaned up by the superposition being removed and the largest sphere being prioritized.
It is worth mentioning that in order to take the survey boundaries and holes present in SDSS-DR12 into account, the void identification process considers an angular mask of the observational data constructed using HEALP IX (Górski et al. 2005). Also, none of the voids identified in the boundaries of the catalog were considered.
2.4. FVS identification
As stated by the Λ-CDM Concordance Cosmological Model, the accelerated expansion dominates the present and future dynamics of the Universe. Within this framework, the FVSs are defined as the largest overdense systems that will remain bound and go through their viralization process during their subsequent evolution. Thus, the identification of FVSs is based on a procedure that searches for current overdense regions that also must satisfy the condition of evolving as connected systems. The details are given in Luparello et al. (2011), who combined the observational method of the luminosity density field (Einasto et al. 2007) with the theoretical criteria of the mass overdensity for a structure to remain bound (Dünner et al. 2006). The main advantage of this procedure is that it can be easily applied in both observational and numerically simulated galaxy data. In order to identify FVSs, we first constructed a luminosity density field by convolving the spatial distribution of the galaxies with a kernel function weighted by galaxy luminosity. This procedure provides a continuous luminosity-density map across the analyzed volume, with a resolution set by cubic cells with a 1 h−1 Mpc side. Then, we applied a percolation algorithm which allowed us to select the connected cells above a certain luminosity threshold. In order to be considered part of a structure, each cell must satisfy  , where ρlum is the luminosity density of the cell and
  is the mean luminosity density of the set of cells. As a result of this procedure, we obtained the list of the cells belonging to each FVS, which allowed us to identify their galaxy members directly. We also imposed 1012 h2 L⊙ as a lower limit for the total FVS luminosities, avoiding contamination from smaller systems.
3. Properties of super-structure catalogs
In this section, we give a brief description of the main properties of the observational FVSs’ and voids’ catalogs which we use throughout this work. We present both the characteristics of the super-structures as a whole and those of the galaxy groups that compose them.
We applied the super-structure identification algorithms described in Sects. 2.3 for voids and 2.4 for FVSs to the full galaxies’ sample presented in Sect. 2.1. We found 512 voids and 150 FVSs, which contain 2041 and 18 355 galaxies, respectively. In both cases, the identified regions show a wide variety of volumes. This is evident in the distribution of void sizes, shown in panel a of Fig. 1, and the distribution of FVS volumes shown in panel b of the same figure. While both structures show broad volume distributions, the FVS span ranges in several orders of magnitude. For the FVSs, we further calculated the total luminosity, whose distribution is shown in panel c of Fig. 1, where it can be seen that they also cover a wide range of values.
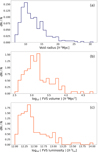 |
Fig. 1. Normalized distributions of properties of the super-structures identified in SDSS-DR12. Void radii are in panel a, FVS volumes are in panel b, and FVS luminosities are in panel c. |
Regarding the general properties of the galaxies populating these regions, Fig. 2 shows in panel a the distributions of the r-band absolute magnitudes Mr − 5log10(h) for the complete sample of galaxies (in yellow), as well as galaxies in voids (in blue) and in FVSs (in red). As expected, the voids galaxies show an excess of faint galaxies (with Mr − 5log10(h) > − 20.5) concerning the full galaxy sample. On the other hand, the FVSs have a higher proportion of bright galaxies (Mr − 5log10(h) < − 21) than the mean. These differences in the galaxy populations can also be reflected in the stellar mass distribution, as shown in panel b of Fig. 2, which has the same color pattern as the above panel to distinguish the object samples.
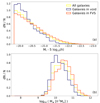 |
Fig. 2. Normalized distributions for properties of galaxies of SDSS-DR12 used in this work. In panel a we show the r-band absolute magnitude and in panel b the stellar mass. In both cases, yellow lines correspond to all galaxies in the catalog, blue lines to galaxies inside cosmic voids, and red lines to galaxies residing in FVSs, as indicated in the key. |
Concerning the dark matter component in these structures, we used the properties of the galaxy groups to estimate their features. We find that of the 98 292 groups that set our main sample of galaxies, 1986 are in voids and 8233 are in FVSs. Panel a of Fig. 3 shows the normalized distribution of the estimated mass for the groups, Mgroup, for the total sample of groups (yellow), the groups within voids (blue curve), and the groups within FVSs (red curve). Panels b and c show these same distributions for groups with 1012 h−1 M⊙ < Mgroup < 1013 h−1 M⊙ and panel (c) shows this for groups with 1013 h−1 M⊙ < Mgroup < 1015 h−1 M⊙, respectively. For the latter subsample, voids only have 22 galaxy groups and, consequently, their statistics is not so robust as in the other samples. As expected, following the inspection of these distributions, it is evident that voids have an excess of low-mass dark matter halos, while FVSs show an excess of high-mass halos.
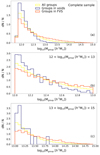 |
Fig. 3. Normalized distribution of mass for the groups identified in SDSS-DR12 by Rodriguez & Merchán (2020). The complete sample is shown in panel a; meanwhile, in panels b and c subsamples with 12 < log10(Mgroup[h−1 M⊙] < 13 and 13 < log10(Mgroup[h−1 M⊙] < 15 are shown, respectively. In all cases, the complete group samples (or subsamples) are in yellow lines, the groups inside voids are in blue, and the groups inside FVSs are in red. |
4. HOD analysis in extreme density environments
To estimate the HOD, we assumed that each group represents a dark matter halo and we computed the average number of galaxies in groups of a given mass, ⟨Ngal|Mgroup⟩. Taking galaxy group membership into account, one can obtain the HOD in a straightforward manner by simply binning in group mass and calculating the average number of galaxies for each mass bin. The measurements of all HODs shown in this work includes both central and satellite galaxies.
To study the behavior of the HOD within the super-structures considered, we followed the procedure described above using only the groups that populate either voids or FVSs. Both super-structures were identified using galaxies as tracers, so both have incomplete groups in regions close to their boundaries. In the case of voids, incomplete groups were removed from the sample before calculating the HOD, whereas for central galaxies residing within the volume of FVSs, we considered their host groups. Since their volumes are several times larger than those of the groups, this criterion does not considerably affect either the boundary conditions of any of the regions or the resulting HOD estimations.
To highlight the effects of these environments on the HOD, we define a third sample of galaxy groups that is not inside voids or FVSs. We call this sample field and we use this to repeat the analyses and measurements performed on the super-structure groups.
Figure 4 shows the behavior of the HOD within the voids, the FVSs, and in the field for different thresholds in absolute magnitude. Similar to both super-structures being identified using the brightest galaxies as tracers, we explored a possible dependence of the variation on the number of satellites with luminosity. The absolute magnitude in the faintest r band for which we can precisely estimate the HOD is Mr − 5log10(h) = − 19.76, since from this point onward the sample is no longer complete in volume and we lose the faint galaxies in the farthest groups. Each panel shows at the top the HOD for the field group sample in green, the HOD within FVSs in red, and the HOD within voids in blue. We note that the last Mgroup bin is only populated by FVS galaxy groups. The statistical uncertainty for this point is low. So this represents value information about the galaxy groups, although there is not a counterpart in the field or voids sample. The lower panels present the ratio between the measurements within these regions and the overall result. Uncertainties in the calculations were computed with the jackknife technique. For this purpose, we separated the sample of halos into 50 equal subsamples, and we computed HOD variations when we did not consider each of these subsamples in the measurements. We also tested the results using 10, 100, and 150 subsamples in the jackknife procedure, finding that, for 50 or more subsamples, the variance values stabilize. As can be seen, for all the absolute magnitude ranges studied (Mr − 5log10(h) = − 19.76, −20, −20.5 and −21), the HOD is systematically lower within the voids. In the FVSs, on the other hand, the measurements are systematically higher. Remarkably, there is no dependence on luminosity. Although the most luminous galaxies may have some relation with the definition of the environment, the results are consistent in the entire range of magnitudes studied. To test the robustness of the results independent of the halo-mass estimation method, we reproduced this analysis using the dynamic mass of the groups similar to the halo mass proxy. We recovered similar trends for the differences in the halo occupation.
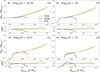 |
Fig. 4. HOD measured in four different magnitude ranges: Mr − 5log10(h) < − 19.76, −20, −20.5, and −21 in panels a–d, respectively. We show the HOD computed in the field in green, the HOD inside voids in blue, and the HOD in FVSs in red, as indicated in the key. We also show the ratio between the HOD measured in the structures and the HOD in the field at the bottom of each panel. All uncertainties were calculated by the standard jackknife procedure. |
These results, even with the intrinsic differences of each sample, are completely consistent with those found in previous works on simulated data (Alfaro et al. 2020, 2021). Within the voids, the HODs decrease by up to 50% concerning the field groups with masses above ∼1013 h−1 M⊙. While within the FVSs, they increase by up to 40%. Moreover, it is remarkable that within both regions, systematic changes in the HOD are only observed from groups with masses larger than ∼1012 h−1 M⊙. This is in agreement with the simulations, where the differences in the occupation of the dark matter halos in the simulations also only appear from halos with masses close to this critical value. This is relevant because it seems to indicate that for masses below this critical value, how the halo is populated does not depend on the large-scale environment. However, above this mass, the environment starts to play an important role in the average number of galaxies in the halos.
4.1. Density dependence
The identification of cosmic voids requires a threshold value for the integrated density contrast Δlim to be set. This parameter defines voids as regions with an integrated density contrast at Rvoid lower than the limiting value (see Sect. 2.3). In this work, we consider the usually adopted value Δlim = −0.9. Given this rather strict restriction, we expect a homogeneous behavior across the cosmic void sample.
On the other hand, FVSs are identified from a luminosity density field and, unlike voids, no parameter determines the integrated density inside the FVSs. For this reason, we may expect super-structures with different mean integrated densities. Even within the same FVS, it is possible to find density variations between the outer and inner regions (Luparello et al. 2011). In the identification procedure of FVSs (see Sect. 2.4), we associate two parameters with each galaxy which characterize its local and global luminosity density: δLloc and δLglob corresponding to a 1 h−1 Mpc and a 13 h−1 Mpc cube, respectively. By definition, all galaxies in FVSs have δLloc > 5.5; however, there is a spread in their δLglob values. Galaxies with δLglob < 5.5 are likely located at the edge of FVSs, while those with δLglob > 5.5 reside in the inner regions. This parameter allowed to study any dependence of the HOD on the density of the environment by considering different regions within FVSs.
In panel a of Fig. 5, we show the dependence of the HOD with the Δlim parameter of the voids. We identified voids with integrated density contrasts Δlim = −0.6, −0.7, and −0.8, and we measured the HOD within each sample and compared them with the result of the HOD measured in the field. The field HOD is shown with a green line, while the blue lines correspond to the HOD measured within the different catalogs of voids. In panel b of the same figure, we show the HOD within the FVSs for different values of δLglob in red lines. We also contrast these results with those of the field, shown with green lines. In both cases, the bottom panels show the ratio between the different HODs and the HOD measured in the field.
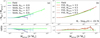 |
Fig. 5. Dependence of the HOD with the identification parameters of voids and FVSs for galaxies with Mr − 5log10(h) < − 19.76. In panel (a), we show the HOD measured in voids identified with a different integrated density contrast threshold, from Δlim = −0.9 in dark blue to Δlim = −0.6 in light blue. In panel (b), we show the HOD measured in FVSs with a different global luminosity threshold, from δLglob > 3.5 in light red to δLglob > 6.5 in dark red. In both cases, the HOD measured in the field is shown with green lines. For a better quantification of the differences, inferior panels show the ratio between the HOD measured in super-structures and the HOD of the field. All the uncertainties were calculated using the standard jackknife procedure. |
As we can see, there is a clear dependence on the mean number of galaxies in the groups, the density limit value used to identify voids, and the regions with the highest luminosity density in the FVSs. For both under-dense and over-dense regions, the differences in the HOD increase as the density of the large-scale region surrounding the groups reaches extreme values. As we relax these conditions, the HOD becomes similar to the field. We also performed both analyses for Mr − 5log10(h) = − 20, −20.5, and −21, finding similar results.
4.2. Dependence on structure properties
We have previously analyzed the correlation between the average number of galaxies in groups and the large-scale structure. In this subsection we search for a possible dependence of the HOD on intrinsic properties of voids and FVSs.
In addition to the criterion of a threshold galaxy density for voids, these can be characterized by their size and the density of the surrounding environment. According to the latter criterion, voids can be classified as R-type and S-type (Ceccarelli et al. 2013; Paz et al. 2013). R-type voids are surrounded by large-scale under-dense regions, while S-types are embedded in global over-dense regions. To further explore the behavior of the HOD according to these properties, we divided our group sample into voids according to the void radius and void-type classification. Then, we measured the mean number of galaxies per group in the same way as described in Sect. 4. The relative HOD results for galaxies with Mr − 5log10(h) < − 19.76 can be seen in Fig. 6. Panel a shows the ratio of the HOD for four subsamples of voids according to their radius values: Rvoid < 10 h−1 Mpc, 10 h−1 Mpc < Rvoid < 15 h−1 Mpc, 15 h−1 Mpc < Rvoid < 20 h−1 Mpc, and 20 h−1 Mpc < Rvoid, with respect to the HOD of the full void catalog. Panel b, on the other hand, shows the ratios of the HOD in R-type (dashed line) and S-type (dotted line) voids concerning the HOD of the full catalog of groups within voids. For both cases, we find no clear dependence of the HOD behavior on the size or type of the void. Thus, the HOD has a reasonable universal behavior in voids.
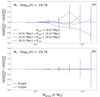 |
Fig. 6. Voids’ size. Panel a: dependence of the HOD measured inside cosmic voids with void sizes Rvoid. Different line types correspond to different void radius intervals, as indicated in the key. Voids’ type. Panel b: same as panel a, but considering the void dynamical classification, where S-type voids are shown with dotted lines and R-type voids are shown with dashed lines. For both panels, all the uncertainties were calculated by the standard jackknife procedure. |
For FVSs, we have studied a possible dependence on the volume of these super-structures. For this aim, we divided the sample into three bins – VFVS < 2500 h−3 Mpc3, 2500 h−3 Mpc3 < VFVS < 5000 h−3 Mpc3, and 5000 h−3 Mpc3 < VFVS – and we computed the HOD in each of them. The results are given in Fig. 7, where the different lines correspond to the ratio between the HOD of each bin in FVS volume and the HOD measured for the full FVS sample. Again, here, there is not a clear piece of evidence of a dependence between the volume of the super-structures and the HOD behavior. Both voids and FVS observational results are in agreement with our predictions in simulated data (Alfaro et al. 2020, 2021), where no evidence of a correlation between HOD variations and intrinsic properties of large-scale regions is detected.
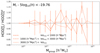 |
Fig. 7. Ratios between the HOD for different FVS volume ranges (indicated in the key figure) and the complete FVS sample. All the uncertainties were calculated by the standard jackknife procedure. |
5. Central galaxy group formation time
In Alfaro et al. (2020, 2021), we found evidence that simulated dark matter halos have different formation times when they reside in voids or in FVSs. In addition, there are correlations between the density of the large-scale environment surrounding halos, their formation times, and the HOD. Halos in voids are younger and have lower HODs than average, while halos in FVSs are older and have higher HODs.
In the simulations, it is possible to follow the formation history of each dark matter halo to determine its formation time. In this observational data set, we used the onset time of star formation in the central galaxy of the group as a system age indicator. This parameter was predicted by the stellar mass model of Maraston et al. (2006), and we call it T⋆. This parameter has a timescale that is different from the redshift formation time of the simulations and it should be understood as a statistical indicator of the variation in formation and evolution times of the galaxy groups on each environment and not as an estimator of the age of the dark matter halos. We define the central galaxy of each group as the brightest object and calculated the cumulative distribution of T⋆ for the field sample and the group samples in voids and FVSs.
Panel a in Fig. 8 shows the cumulative distribution of the T⋆ parameter for the group samples in the field (green), voids (blue), and FVSs (red). The inset panel in this figure presents the ratio between super-structures and the field. Using the same format, panels b and c show the same thing, but for groups with 1012 h−1 M⊙ < Mgroup < 1013 h−1 M⊙ and 1013 h−1 M⊙ < Mgroup < 1014 h−1 M⊙, respectively.
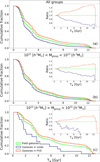 |
Fig. 8. Top: cumulative distribution of the T⋆ parameter for field galaxies (green), void galaxies (blue), and FVS galaxies (red). Panel a shows the distributions for the complete galaxy sample, meanwhile panels b and c are for the galaxies residing in groups with 1012 h−1 M⊙ < Mgroup < 1013 h−1 M⊙ and 1013 h−1 M⊙ < Mgroup < 1015 h−1 M⊙, respectively. Inset panels show the ratio between the cumulative fraction of T⋆ for galaxies inside voids and FVSs, in addition to field galaxies. |
In all group samples, it is clear that objects within voids have T⋆ lower than the mean. On the contrary, clusters residing in FVSs have higher T⋆ values. Generally speaking, we may say that star formation started earlier in FVSs than on average contrary to voids which show a more recent onset of the star formation process. These results are in agreement with the differences in the formation times of dark matter halos found in the synthetic data. Thus, we confirm, from the observational side, evidence for a correlation between the HOD, the halo large-scale density environment, and the formation time of the halos.
We have already seen that the galaxy groups populating voids and FVSs have a different average number of galaxies as well as different star formation times for their central galaxy. In this section, we further explore the relation between these two properties and calculate the HOD as a function of the T⋆ parameter, rather than their r-band luminosity.
For this purpose, we sorted the entire sample of galaxies (including central and satellite galaxies) by their T⋆ and consider those in the first and fourth quartiles separately. This is equivalent to taking the 25% fraction of the oldest and youngest galaxies which correspond to those with T⋆ ≤ 1.434 Gyr and 2.75 Gyr ≤ T⋆, respectively. In order to analyze these two galaxy populations and the way they are affected by environment, we calculated their HOD within cosmic voids, FVSs, and the field. The procedure is the same as described in Sect. 4, except that here we only consider those galaxies belonging to these two quartile subsamples.
Panel a of Fig. 9 shows the measured HOD for the 25% younger galaxies; the blue, red, and green lines represent the result within the voids, FVSs, and field, respectively. We can see that in the case of the FVSs, the environment effects are the same as in Sect. 4 and the number of young galaxies per group increases by almost 50% concerning the field. In addition, we see that low-mass groups only host young galaxies when they reside inside cosmic voids. In Panel b, we show the HOD results for the 25% oldest galaxies in the sample. We see here that groups in cosmic voids lack this old population, while, on the contrary, FVS groups show a higher number of old satellites as compared to field groups.
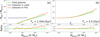 |
Fig. 9. HOD for galaxies in the first and fourth quartile of T⋆, shown in panels a and b, respectively. In both cases, field galaxies are in green lines, void galaxies are in blue, and FVS galaxies are in red. All uncertainties were calculated with the jackknife procedure. |
In general, we can conclude that for groups residing in FVSs, the HOD variation with respect to the field is similar for young and old galaxies. We have confirmed this conclusion by varying the definitions of young and old galaxies with different T⋆ thresholds and finding results totally consistent with those described above.
6. Summary and conclusions
The HOD is a powerful tool linking galaxies to their host dark matter halos. In this work, we use observational data to study the HOD behavior in different large-scale environments with extreme density values. We have considered cosmic voids and FVSs as low and high density super-structures. We used a volume complete sample of SDSS-DR12, restricted to Mr − 5log10(h) < − 19.76 galaxies, and the galaxy group catalog of Rodriguez & Merchán (2020). We have applied voids and FVS identification algorithms to define three galaxy groups samples: groups in voids, FVSs, and the field (groups that are not located in either region).
We find a statistically significant difference between the HOD of groups residing in these two environments. Inside cosmic voids, the HOD is consistent with a decrease up to ∼50% in the mean number of satellites from groups with masses above 1013 h−1 M⊙, with respect to the field. Conversely, for groups in FVSs, the HOD shows an increase up to ∼40% the most massive groups (∼1014 − 1015 h−1 M⊙). Also, we note that the FVS sample is the one that contains the groups with the highest mass. These results are present for all luminosity ranges explored.
For both types of environments, we find a clear dependence of the HOD on galaxy density. In cosmic voids, the HOD difference with respect to the field increases as the value of the Δlim parameter lowers, that is to say toward more empty voids. On the other hand, in FVSs, the differences are larger in the central, densest regions with the highest values of the δLglob parameter.
The aforementioned results are present only for massive groups, in other words with masses greater than ∼1012 h−1 M⊙. Irrespective of the large-scale environment, the HOD for groups with masses lower than ∼1012 h−1 M⊙ exhibit no variations. This indicates that for these groups, the formation of galaxies is nearly independent of the large-scale environment density. In Sect. 3, we also find no evidence that the HOD variations depend on the intrinsic properties of the super-structures. Inside the voids, the HOD is independent of the radii and the surrounding structure. For the FVSs, the HOD shows no dependence with the super-structure volume. All of these results are consistent with what was observed in simulated data in Alfaro et al. (2020, 2021).
Finally, in Sect. 5, we show that the central galaxy of groups within voids has an onset time of star formation (T⋆ parameter) lower than their counterpart in field groups. In FVSs, the central galaxies of groups show systematically higher star formation times. These results could be related to the differences in the assembly time of dark matter halos, as reported in previous works. In simulations, halos inside FVSs formed earlier than average, contrary to the more recent assembly inside cosmic voids.
For a more detailed analysis, we further explored the HOD for the 25% fraction of the oldest and youngest galaxies based on the galaxy T⋆ values. We find that the youngest galaxies within low-mass groups (< 1012 h−1 M⊙) are limited to the inner regions of cosmic voids. The youngest galaxies within high-mass groups (> 1012 h−1 M⊙) are mainly found in the field and in FVSs. Thus, there is a connection between astrophysical galaxy properties and the HOD regarding the environment.
Regardless of group mass, the oldest galaxies mainly reside in FVSs and in the field. Thus, cosmic void galaxies lack old stellar populations irrespective of their local environment. Galaxies with an evolved stellar population are mainly located in FVSs and field groups with a diverse rangein mass. It is worth noticing that groups in FVSs and in the field (i.e., the average galaxy environment) host galaxies with no significant fraction of young objects. This fact is reversed in voids, where there is an absence of old galaxies. Different processes lead to this result comprising dark matter, stars, and gas accretion in groups. The recent halo assembly in low density regions (Sheth & Tormen 2004), together with a large gas reservoir, is a key factor determining this behavior in voids. Whereas the time that elapsed between FVSs and the field is not as large. In addition, as group mass increases, the astrophysical effects inhibiting star formation, such as tidal stripping, ram pressure, and harassment, play a more significant role.
Our work provides evidence that large-scale environment-combined effects manifest in both the HOD as well as galaxy astrophysics. We stress the fact that the HOD dependence on a large-scale environment has an impact on the halo assembly scenario and particularly on small-scale clustering (Gao et al. 2005; Li et al. 2008; Montero-Dorta et al. 2021). Thus, the one-halo term may be related to the second halo term in a complex way so as to be addressed in future works. Similar studies in future deeper surveys may highlight the interplay between HOD and galaxy astrophysical properties at early epochs where density contrasts associated to FVSs and cosmic voids are lower than at the present.
This information was extracted from skyserver.sdss.org/dr12/; further details of these data can be found in the stellarMassStarformingPort table.
Acknowledgments
This work was partially supported by Agencia Nacional de Promoción Científica y Tecnológica (PICT 2015-3098, PICT 2016-1975), the Consejo Nacional de Investigaciones Científicas y Técnicas (CONICET, Argentina) and the Secretaría de Ciencia y Tecnología de la Universidad Nacional de Córdoba (SeCyT-UNC, Argentina). Funding for the SDSS and SDSS-II has been provided by the Alfred P. Sloan Foundation, the Participating Institutions, the National Science Foundation, the U.S. Department of Energy, the National Aeronautics and Space Administration, the Japanese Monbukagakusho, the Max Planck Society, and the Higher Education Funding Council for England. The SDSS Web Site is http://www.sdss.org/. The SDSS is managed by the Astrophysical Research Consortium for the Participating Institutions. The Participating Institutions are the American Museum of Natural History, Astrophysical Institute Potsdam, University of Basel, University of Cambridge, Case Western Reserve University, University of Chicago, Drexel University, Fermilab, the Institute for Advanced Study, the Japan Participation Group, Johns Hopkins University, the Joint Institute for Nuclear Astrophysics, the Kavli Institute for Particle Astrophysics and Cosmology, the Korean Scientist Group, the Chinese Academy of Sciences (LAMOST), Los Alamos National Laboratory, the Max-Planck-Institute for Astronomy (MPIA), the Max-Planck-Institute for Astrophysics (MPA), New Mexico State University, Ohio State University, University of Pittsburgh, University of Portsmouth, Princeton University, the United States Naval Observatory, and the University of Washington.
References
- Alam, S., Albareti, F. D., Prieto, C. A., et al. 2015, ApJS, 219, 12 [NASA ADS] [CrossRef] [Google Scholar]
- Alfaro, I. G., Rodriguez, F., Ruiz, A. N., & Lambas, D. G. 2020, A&A, 638, A60 [NASA ADS] [CrossRef] [EDP Sciences] [Google Scholar]
- Alfaro, I. G., Ruiz, A. N., Luparello, H. E., Rodriguez, F., & Garcia Lambas, D. 2021, A&A, 654, A62 [NASA ADS] [CrossRef] [EDP Sciences] [Google Scholar]
- Artale, M. C., Zehavi, I., Contreras, S., & Norberg, P. 2018, MNRAS, 480, 3978 [NASA ADS] [CrossRef] [Google Scholar]
- Behroozi, P. S., Conroy, C., & Wechsler, R. H. 2010, ApJ, 717, 379 [Google Scholar]
- Berlind, A. A., & Weinberg, D. H. 2002, ApJ, 575, 587 [Google Scholar]
- Berlind, A. A., Weinberg, D. H., Benson, A. J., et al. 2003, ApJ, 593, 1 [NASA ADS] [CrossRef] [Google Scholar]
- Bose, S., Eisenstein, D. J., Hernquist, L., et al. 2019, MNRAS, 490, 5693 [CrossRef] [Google Scholar]
- Ceccarelli, L., Padilla, N. D., Valotto, C., & Lambas, D. G. 2006, MNRAS, 373, 1440 [NASA ADS] [CrossRef] [Google Scholar]
- Ceccarelli, L., Paz, D., Lares, M., Padilla, N., & Lambas, D. G. 2013, MNRAS, 434, 1435 [NASA ADS] [CrossRef] [Google Scholar]
- Colberg, J. M., Pearce, F., Foster, C., et al. 2008, MNRAS, 387, 933 [NASA ADS] [CrossRef] [Google Scholar]
- Conroy, C., Wechsler, R. H., & Kravtsov, A. V. 2006, J, 647, 201 [Google Scholar]
- Cooray, A., & Sheth, R. 2002, Phys. Rep., 372, 1 [Google Scholar]
- Costa-Duarte, M. V., Sodré, L., Jr, & Durret, F. 2010, MNRAS, 411, 1716 [Google Scholar]
- Dünner, R., Araya, P. A., Meza, A., & Reisenegger, A. 2006, MNRAS, 366, 803 [NASA ADS] [CrossRef] [Google Scholar]
- Einasto, M., Tago, E., Jaaniste, J., Einasto, J., & Andernach, H. 1997, A&AS, 123, 119 [NASA ADS] [CrossRef] [EDP Sciences] [Google Scholar]
- Einasto, M., Einasto, J., Tago, E., Müller, V., & Andernach, H. 2001, AJ, 122, 2222 [NASA ADS] [CrossRef] [Google Scholar]
- Einasto, J., Einasto, M., Tago, E., et al. 2007, A&A, 462, 811 [NASA ADS] [CrossRef] [EDP Sciences] [Google Scholar]
- Gao, L., Springel, V., & White, S. D. M. 2005, MNRAS, 363, L66 [NASA ADS] [CrossRef] [Google Scholar]
- Gonzalez, E. J., Rodriguez, F., Merchán, M., et al. 2021, MNRAS, 504, 4093 [NASA ADS] [CrossRef] [Google Scholar]
- Górski, K. M., Hivon, E., Banday, A. J., et al. 2005, ApJ, 622, 759 [Google Scholar]
- Hoyle, F., Vogeley, M. S., & Pan, D. 2012, MNRAS, 426, 3041 [NASA ADS] [CrossRef] [Google Scholar]
- Jing, Y., Mo, H., & Börner, G. 1998, ApJ, 494, 1 [NASA ADS] [CrossRef] [Google Scholar]
- Kravtsov, A. V., Berlind, A. A., Wechsler, R. H., et al. 2004, ApJ, 609, 35 [Google Scholar]
- Li, Y., Mo, H. J., & Gao, L. 2008, MNRAS, 389, 1419 [NASA ADS] [CrossRef] [Google Scholar]
- Liivamägi, L. J., Tempel, E., & Saar, E. 2012, A&A, 539, A80 [Google Scholar]
- Luparello, H., Lares, M., Lambas, D. G., & Padilla, N. 2011, MNRAS, 415, 964 [Google Scholar]
- Ma, C.-P., & Fry, J. N. 2000, ApJ, 543, 503 [Google Scholar]
- Maraston, C., Daddi, E., Renzini, A., et al. 2006, ApJ, 652, 85 [NASA ADS] [CrossRef] [Google Scholar]
- Merchán, M. E., & Zandivarez, A. 2005, ApJ, 630, 759 [CrossRef] [Google Scholar]
- Montero-Dorta, A. D., Chaves-Montero, J., Artale, M. C., & Favole, G. 2021, MNRAS, 508, 940 [NASA ADS] [CrossRef] [Google Scholar]
- Pan, D. C., Vogeley, M. S., Hoyle, F., Choi, Y.-Y., & Park, C. 2012, MNRAS, 421, 926 [NASA ADS] [CrossRef] [Google Scholar]
- Patiri, S. G., Prada, F., Holtzman, J., Klypin, A., & Betancort-Rijo, J. 2006, MNRAS, 372, 1710 [NASA ADS] [CrossRef] [Google Scholar]
- Paz, D., Lares, M., Ceccarelli, L., Padilla, N., & Lambas, D. G. 2013, MNRAS, 436, 3480 [NASA ADS] [CrossRef] [Google Scholar]
- Peacock, J., & Smith, R. 2000, MNRAS, 318, 1144 [NASA ADS] [CrossRef] [Google Scholar]
- Rodriguez, F., & Merchán, M. 2020, A&A, 636, A61 [NASA ADS] [CrossRef] [EDP Sciences] [Google Scholar]
- Rodriguez, F., Merchán, M., & Sgró, M. A. 2015, A&A, 580, A86 [NASA ADS] [CrossRef] [EDP Sciences] [Google Scholar]
- Rodriguez, F., Montero-Dorta, A. D., Angulo, R. E., Artale, M. C., & Merchán, M. 2021, MNRAS, 505, 3192 [NASA ADS] [CrossRef] [Google Scholar]
- Ruiz, A. N., Paz, D. J., Lares, M., et al. 2015, MNRAS, 448, 1471 [NASA ADS] [CrossRef] [Google Scholar]
- Ruiz, A. N., Alfaro, I. G., & Garcia Lambas, D. 2019, MNRAS, 483, 4070 [NASA ADS] [CrossRef] [Google Scholar]
- Scoccimarro, R., Sheth, R. K., Hui, L., & Jain, B. 2001, ApJ, 546, 20 [NASA ADS] [CrossRef] [Google Scholar]
- Seljak, U. 2000, MNRAS, 318, 203 [Google Scholar]
- Sheth, R. K., & Tormen, G. 2004, MNRAS, 349, 1464 [NASA ADS] [CrossRef] [Google Scholar]
- Vale, A., & Ostriker, J. 2004, MNRAS, 353, 189 [NASA ADS] [CrossRef] [Google Scholar]
- Yang, X., Mo, H. J., van den Bosch, F. C., et al. 2007, ApJ, 671, 153 [Google Scholar]
- Zehavi, I., Contreras, S., Padilla, N., et al. 2018, ApJ, 853, 84 [NASA ADS] [CrossRef] [Google Scholar]
- Zheng, Z., Berlind, A. A., Weinberg, D. H., et al. 2005, ApJ, 633, 791 [NASA ADS] [CrossRef] [Google Scholar]
All Figures
|
Fig. 1. Normalized distributions of properties of the super-structures identified in SDSS-DR12. Void radii are in panel a, FVS volumes are in panel b, and FVS luminosities are in panel c. |
| In the text | |
|
Fig. 2. Normalized distributions for properties of galaxies of SDSS-DR12 used in this work. In panel a we show the r-band absolute magnitude and in panel b the stellar mass. In both cases, yellow lines correspond to all galaxies in the catalog, blue lines to galaxies inside cosmic voids, and red lines to galaxies residing in FVSs, as indicated in the key. |
| In the text | |
|
Fig. 3. Normalized distribution of mass for the groups identified in SDSS-DR12 by Rodriguez & Merchán (2020). The complete sample is shown in panel a; meanwhile, in panels b and c subsamples with 12 < log10(Mgroup[h−1 M⊙] < 13 and 13 < log10(Mgroup[h−1 M⊙] < 15 are shown, respectively. In all cases, the complete group samples (or subsamples) are in yellow lines, the groups inside voids are in blue, and the groups inside FVSs are in red. |
| In the text | |
|
Fig. 4. HOD measured in four different magnitude ranges: Mr − 5log10(h) < − 19.76, −20, −20.5, and −21 in panels a–d, respectively. We show the HOD computed in the field in green, the HOD inside voids in blue, and the HOD in FVSs in red, as indicated in the key. We also show the ratio between the HOD measured in the structures and the HOD in the field at the bottom of each panel. All uncertainties were calculated by the standard jackknife procedure. |
| In the text | |
|
Fig. 5. Dependence of the HOD with the identification parameters of voids and FVSs for galaxies with Mr − 5log10(h) < − 19.76. In panel (a), we show the HOD measured in voids identified with a different integrated density contrast threshold, from Δlim = −0.9 in dark blue to Δlim = −0.6 in light blue. In panel (b), we show the HOD measured in FVSs with a different global luminosity threshold, from δLglob > 3.5 in light red to δLglob > 6.5 in dark red. In both cases, the HOD measured in the field is shown with green lines. For a better quantification of the differences, inferior panels show the ratio between the HOD measured in super-structures and the HOD of the field. All the uncertainties were calculated using the standard jackknife procedure. |
| In the text | |
|
Fig. 6. Voids’ size. Panel a: dependence of the HOD measured inside cosmic voids with void sizes Rvoid. Different line types correspond to different void radius intervals, as indicated in the key. Voids’ type. Panel b: same as panel a, but considering the void dynamical classification, where S-type voids are shown with dotted lines and R-type voids are shown with dashed lines. For both panels, all the uncertainties were calculated by the standard jackknife procedure. |
| In the text | |
|
Fig. 7. Ratios between the HOD for different FVS volume ranges (indicated in the key figure) and the complete FVS sample. All the uncertainties were calculated by the standard jackknife procedure. |
| In the text | |
|
Fig. 8. Top: cumulative distribution of the T⋆ parameter for field galaxies (green), void galaxies (blue), and FVS galaxies (red). Panel a shows the distributions for the complete galaxy sample, meanwhile panels b and c are for the galaxies residing in groups with 1012 h−1 M⊙ < Mgroup < 1013 h−1 M⊙ and 1013 h−1 M⊙ < Mgroup < 1015 h−1 M⊙, respectively. Inset panels show the ratio between the cumulative fraction of T⋆ for galaxies inside voids and FVSs, in addition to field galaxies. |
| In the text | |
|
Fig. 9. HOD for galaxies in the first and fourth quartile of T⋆, shown in panels a and b, respectively. In both cases, field galaxies are in green lines, void galaxies are in blue, and FVS galaxies are in red. All uncertainties were calculated with the jackknife procedure. |
| In the text | |
Current usage metrics show cumulative count of Article Views (full-text article views including HTML views, PDF and ePub downloads, according to the available data) and Abstracts Views on Vision4Press platform.
Data correspond to usage on the plateform after 2015. The current usage metrics is available 48-96 hours after online publication and is updated daily on week days.
Initial download of the metrics may take a while.