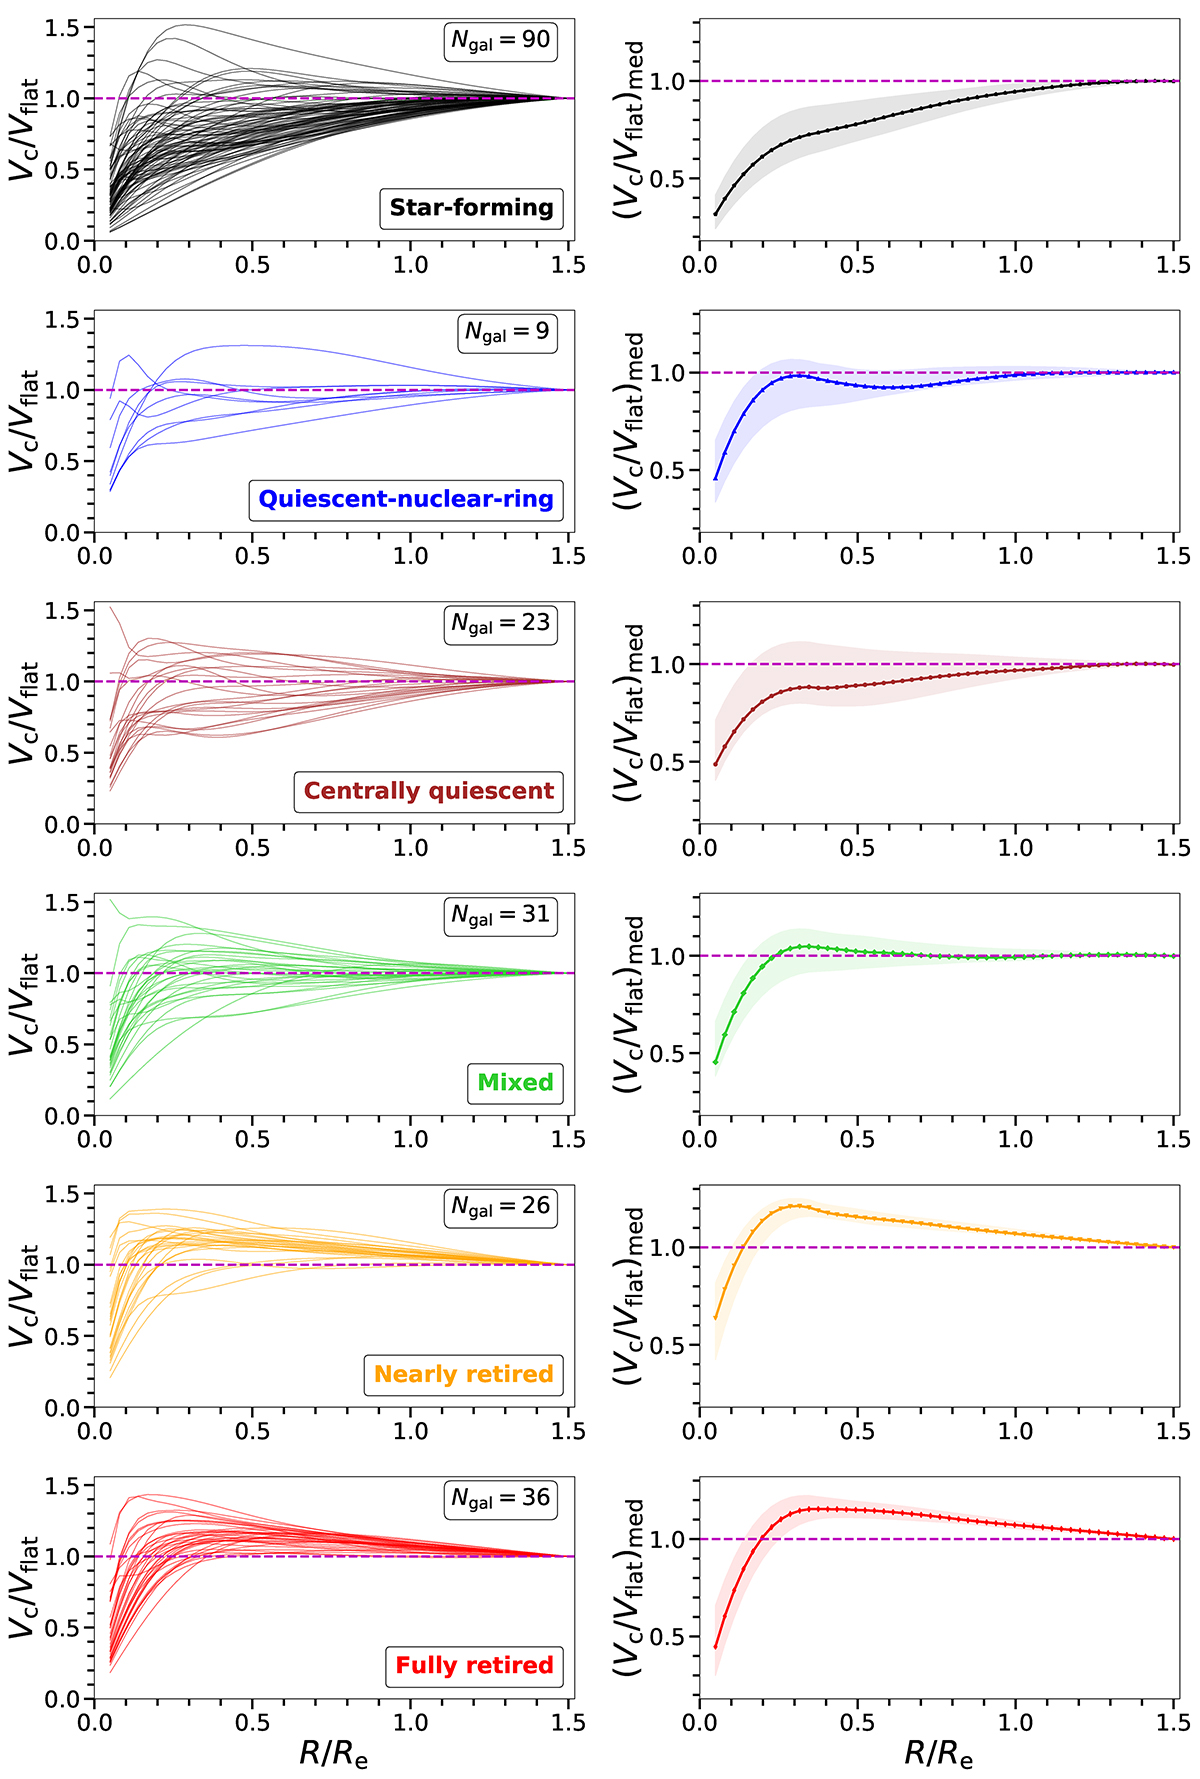
Fig. A.2.
Download original image
Normalised circular velocity profiles. Left panels: Circular velocity profiles, normalised with respect to the asymptotic velocity (thin coloured lines), grouped into the six quenching stages as defined in K21. Right panels: The median smoothed curve of the circular velocity profiles, normalised with respect to the asymptotic velocity (thick coloured lines) for each quenching group. The shadowed regions indicate the dispersion of the curves from the median value. The magenta horizontal line indicates the unity value between the two velocities.
Current usage metrics show cumulative count of Article Views (full-text article views including HTML views, PDF and ePub downloads, according to the available data) and Abstracts Views on Vision4Press platform.
Data correspond to usage on the plateform after 2015. The current usage metrics is available 48-96 hours after online publication and is updated daily on week days.
Initial download of the metrics may take a while.