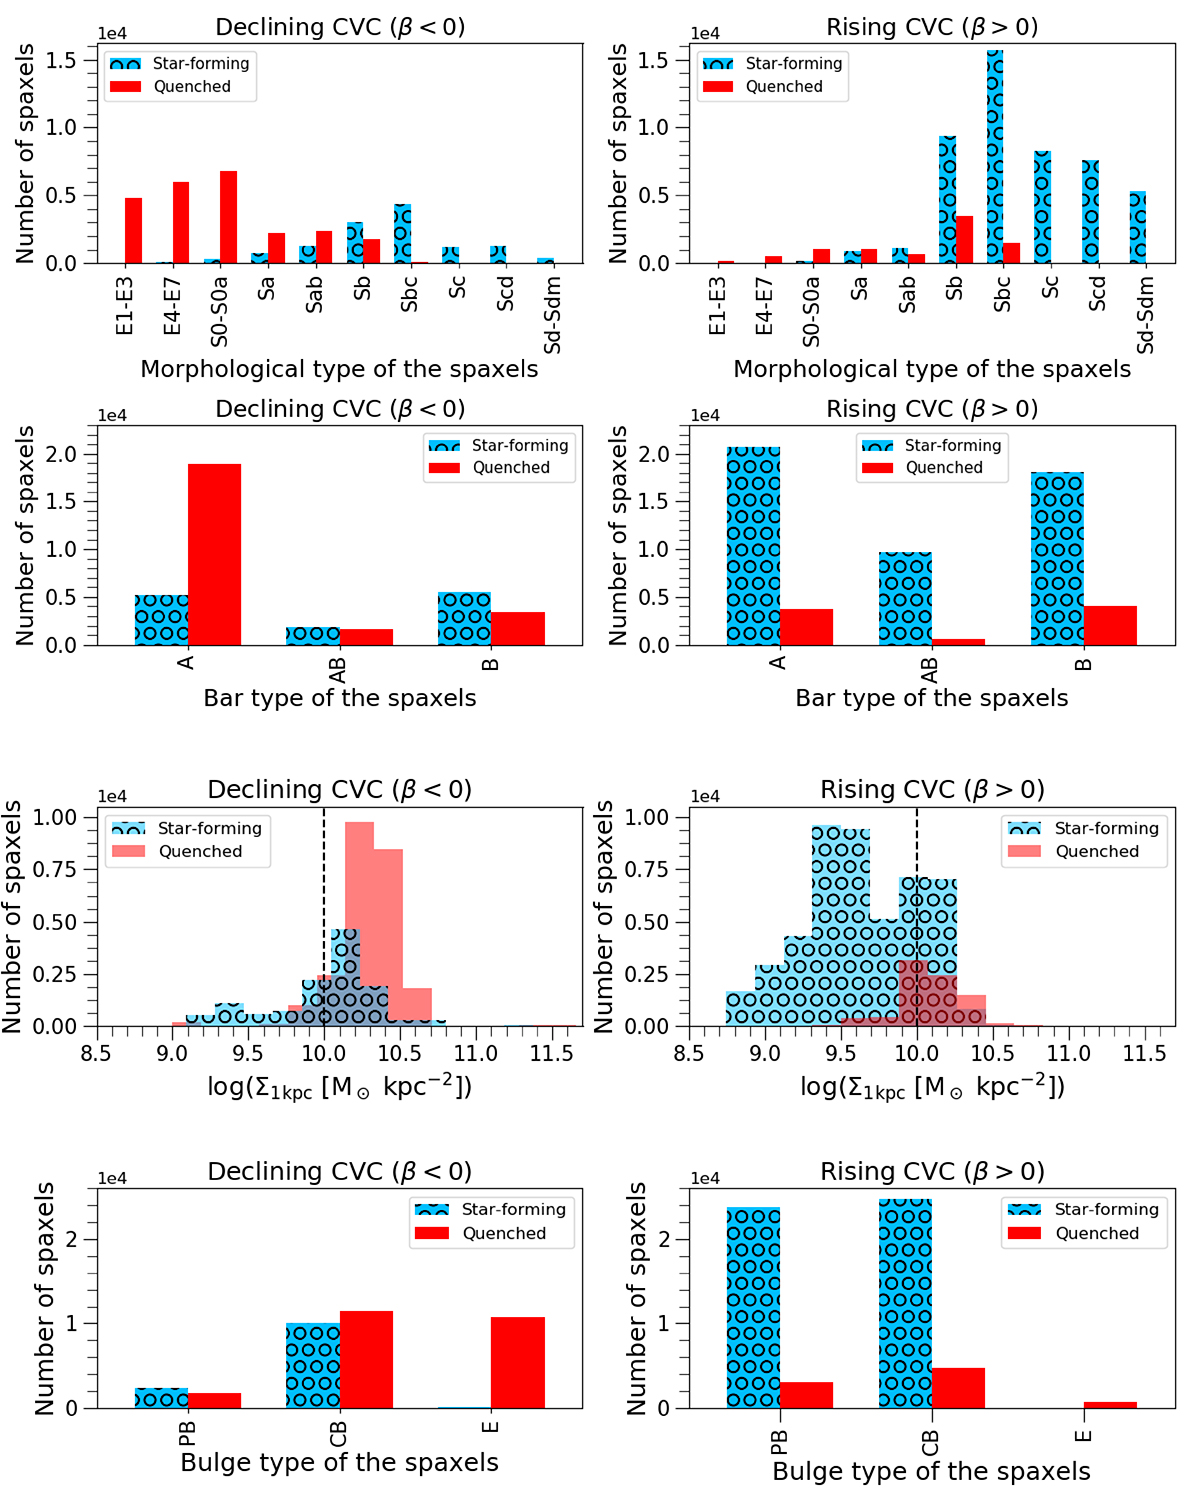
Fig. 6.
Download original image
Spaxel distribution of WHα − β relation across properties of the host galaxies. First and the second row panels correspond to the morphological and bar-type (A: no bar, B: bar, and AB: unsure bar) classifications of the galaxies from Walcher et al. (2014), respectively. Third row panels explore the central stellar mass surface density (Sánchez et al. 2016b,c) within 1 kiloparsec (Σ1 kpc) of the host galaxies, following Cheung et al. (2012). Fourth row panels relates to the bulge type of the host galaxies, according to the method described in Luo et al. (2020, PB: pseudo bulge, CB: classical bulge, and E: ellipticals). Left column panels explore the statistics of the spaxels for the declining CVCs (β < 0), while the right panels correspond to the rising CVCs (β > 0). The different colours and symbols of the bars in the panels distinguish star-forming (blue with black circle) and quenched (red with no symbol) regions of the galaxies. The dashed horizontal lines at Σ1kpc = 1010 M⊙ kpc−2 are drawn to guide the eye. See more details in Sect. 3.2.
Current usage metrics show cumulative count of Article Views (full-text article views including HTML views, PDF and ePub downloads, according to the available data) and Abstracts Views on Vision4Press platform.
Data correspond to usage on the plateform after 2015. The current usage metrics is available 48-96 hours after online publication and is updated daily on week days.
Initial download of the metrics may take a while.