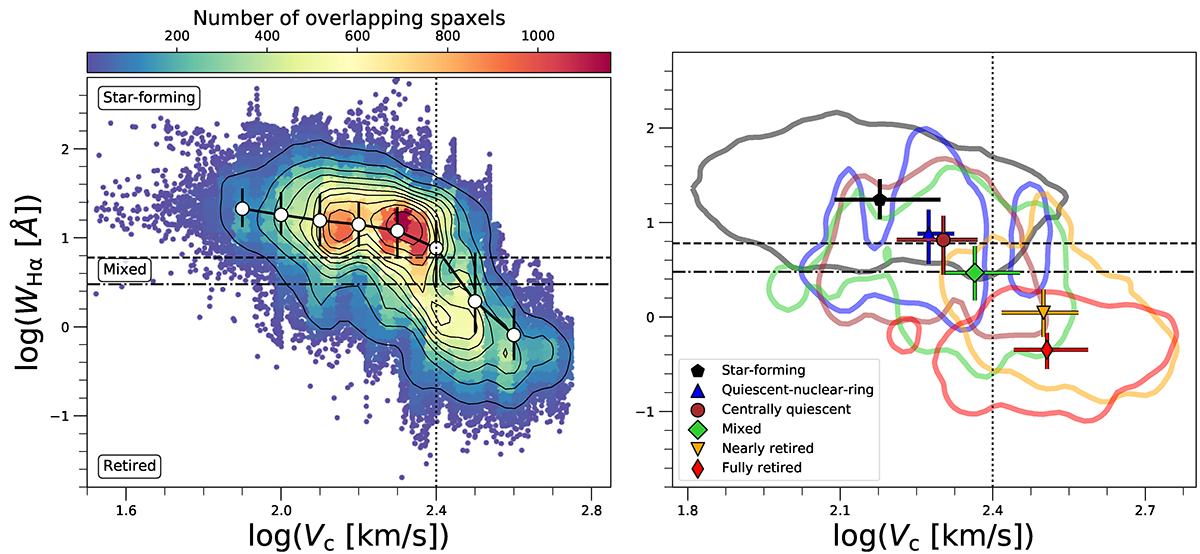
Fig. 3.
Download original image
CVC amplitude versus Wα, which defines the quenching, mixed, and star-forming regions of the galaxies at each position of the sky. Left panel: bi-dimensional histograms (colours) overlaid with black contours indicating the regions that contain between 15% and 90% of the total number of points. White circles indicate the sample WHα medians within bins of 0.1 dex, while the vertical black bars encompass the 25th to the 75th percentiles of the distributions within the bins. (We note that the estimated median values do not generally correspond to the peaks of the spaxel distribution indicated by the redder colours or by the contour levels because of the non-Gaussian distributions of the WHα values within given Vc bins.) The colour bar indicates the number of the overlapping spaxels. Right panel: coloured contours contain 95% of the data points within a given quenching stage. With the same colours, the markers indicate the positions of the medians of the WHα and Vc distributions of each stage, while the coloured bars mark the extension of the distributions within the 25th and 75th percentiles. Dashed-dotted and dashed black horizontal lines indicate the positions of WHα = 3 Å and WHα = 6 Å, respectively. The vertical dotted line marks the critical velocity of log(Vc)∼2.4 km s−1 (Vc ∼ 250 km s−1) at which the relation starts to steepen.
Current usage metrics show cumulative count of Article Views (full-text article views including HTML views, PDF and ePub downloads, according to the available data) and Abstracts Views on Vision4Press platform.
Data correspond to usage on the plateform after 2015. The current usage metrics is available 48-96 hours after online publication and is updated daily on week days.
Initial download of the metrics may take a while.