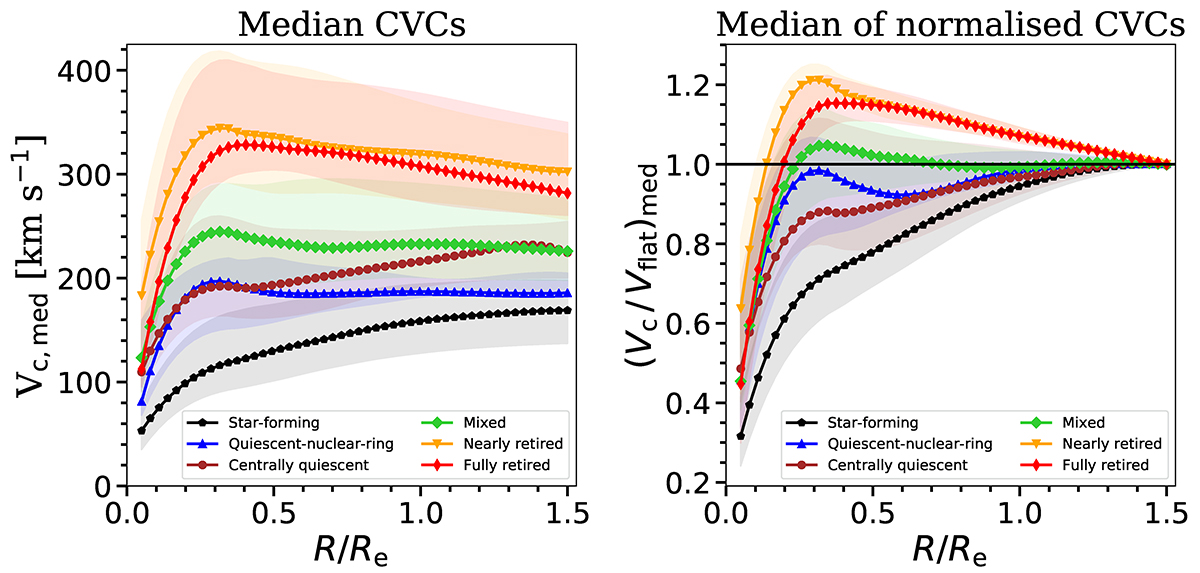
Fig. 2.
Download original image
Average CVC profiles. Left: median curve of the CVC profiles for each quenching stage group from star-forming to fully retired galaxies. Right: median of the CVC profiles, normalised with respect to the asymptotic velocity for each quenching-stage group. The uncertainty bands correspond to the 25th percentile (below) and the 75th percentile (above) of the median distribution. To smooth the median CVCs and the percentile profiles, we apply the Savitzky-Golay smoothing filter (Savitzky & Golay 1964) by adopting a third-degree polynomial and a 21-point wide sliding window (see Sect. 3).
Current usage metrics show cumulative count of Article Views (full-text article views including HTML views, PDF and ePub downloads, according to the available data) and Abstracts Views on Vision4Press platform.
Data correspond to usage on the plateform after 2015. The current usage metrics is available 48-96 hours after online publication and is updated daily on week days.
Initial download of the metrics may take a while.