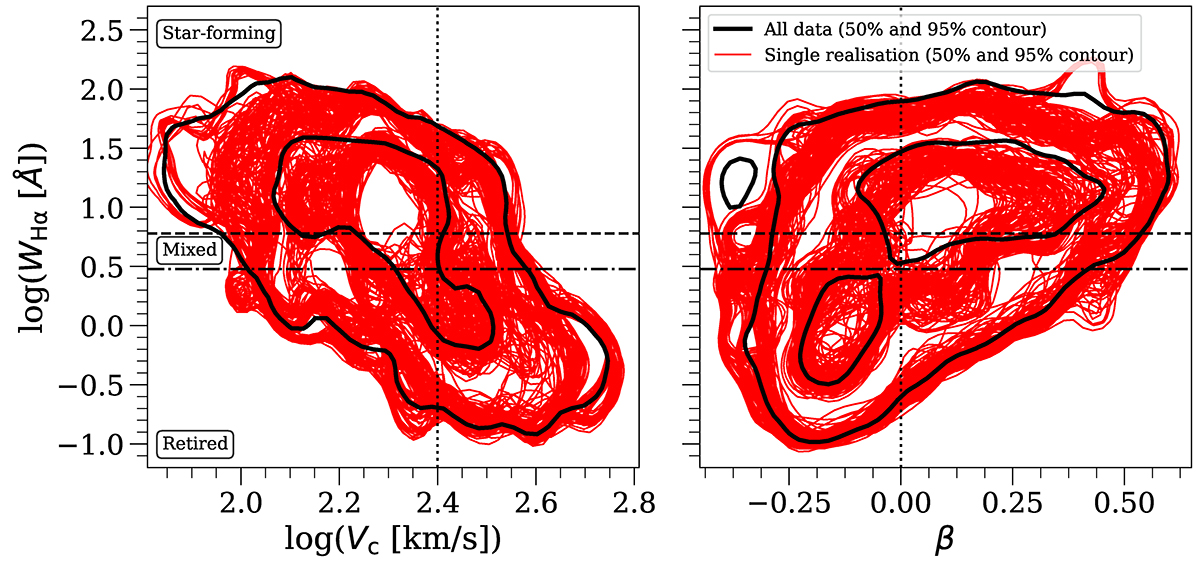
Fig. C.1.
Download original image
Testing the stability of the resolved scaling relations (WHα − Vc, left; WHα − β, right) through a cross-validation technique. The red lines indicate the spaxels of 60 randomly selected galaxies from the original data set (where 10 galaxies from each of the 6 quenching stages are chosen) for 100 single realisations. The inner and the outer contours represent the relationships constructed with 50% and 95% of the spaxel distribution, respectively, of the full sample of 215 galaxies (black contours) and each subsample of 60 galaxies (red contours). Both relationships overall show stability regarding the studied sample across quenching stage.
Current usage metrics show cumulative count of Article Views (full-text article views including HTML views, PDF and ePub downloads, according to the available data) and Abstracts Views on Vision4Press platform.
Data correspond to usage on the plateform after 2015. The current usage metrics is available 48-96 hours after online publication and is updated daily on week days.
Initial download of the metrics may take a while.