Open Access
Fig. 5.
Download original image
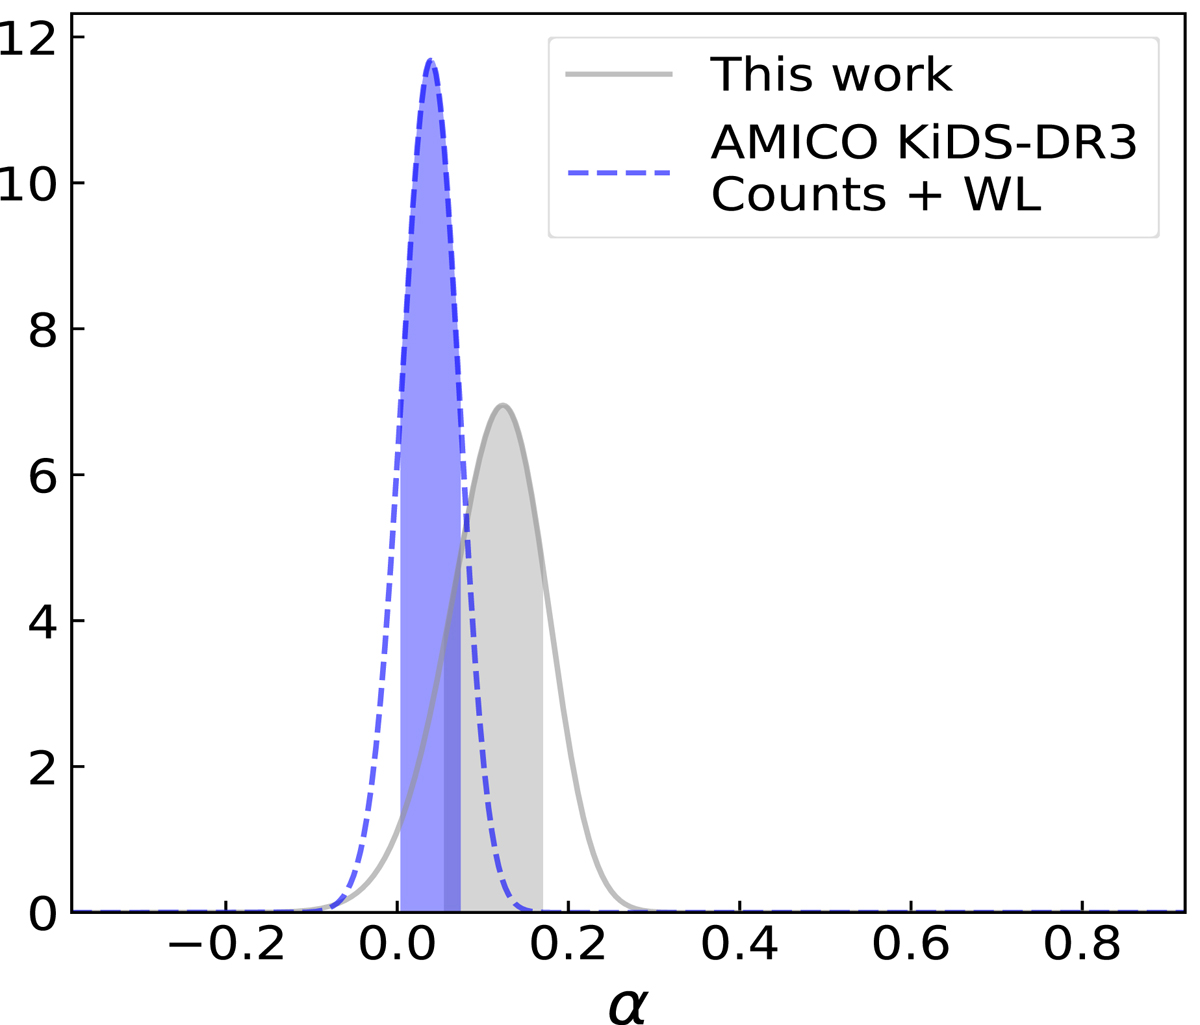
Constraint on the normalisation of the mass-richness relation, α. The result obtained from the cluster clustering analysis is shown in grey, and the constraint derived from the joint analysis of counts and weak lensing (Lesci et al. 2022) is shown in blue. The bands show the intervals between the 16th and 84th percentiles.
Current usage metrics show cumulative count of Article Views (full-text article views including HTML views, PDF and ePub downloads, according to the available data) and Abstracts Views on Vision4Press platform.
Data correspond to usage on the plateform after 2015. The current usage metrics is available 48-96 hours after online publication and is updated daily on week days.
Initial download of the metrics may take a while.