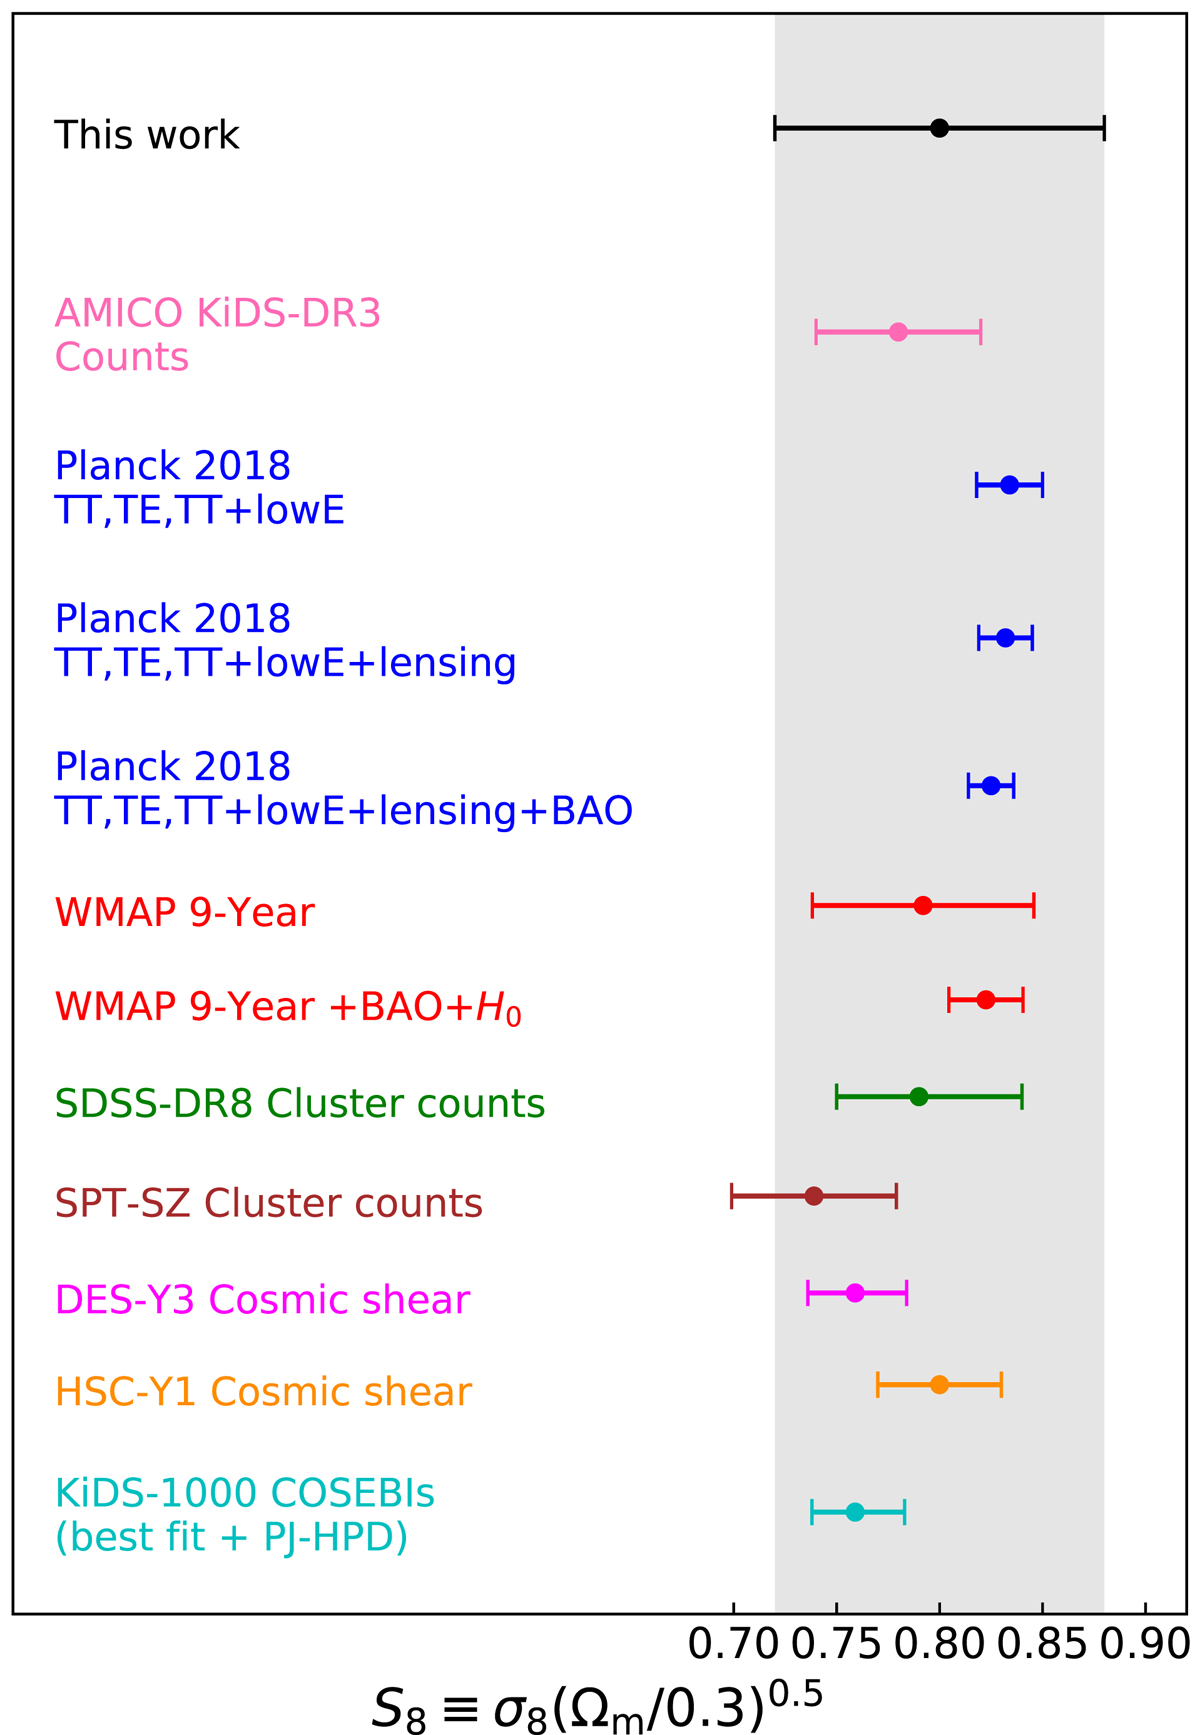
Fig. 4.

Download original image
Comparison of the constraints on S8 ≡ σ8(Ωm/0.3)0.5 obtained, from top to bottom, from the cluster clustering analysis in the AMICO KiDS-DR3 catalogue (black dot), from the joint analysis of cluster counts and weak lensing in KiDS-DR3 performed by Lesci et al. (2022, pink dot), from the results obtained by Planck Collaboration VI (2020, blue dots), Hinshaw et al. (2013, red dots), Costanzi et al. (2019, green dot), Bocquet et al. (2019, brown dot), Amon et al. (2022) and Secco et al. (2022, magenta dot), Hikage et al. (2019, orange dot), and Asgari et al. (2021, cyan dot). The median and the 16th and 84th percentiles are shown.
Current usage metrics show cumulative count of Article Views (full-text article views including HTML views, PDF and ePub downloads, according to the available data) and Abstracts Views on Vision4Press platform.
Data correspond to usage on the plateform after 2015. The current usage metrics is available 48-96 hours after online publication and is updated daily on week days.
Initial download of the metrics may take a while.


