Open Access
Fig. 2.
Download original image
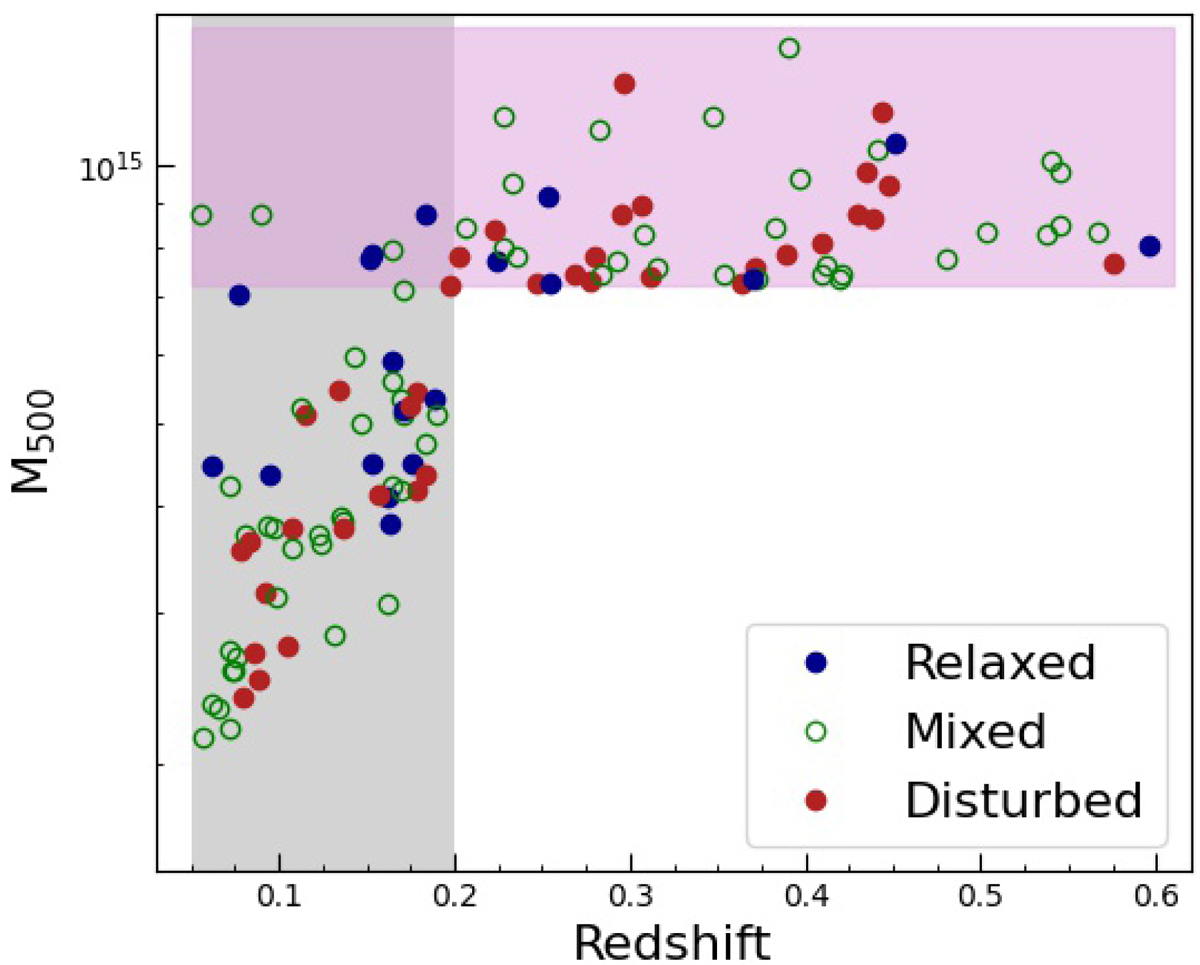
Distribution in the M500 − z plane of the 118 CHEX-MATE clusters. The colour scale represents the dynamical state obtained from the visual classification. The shaded area indicate the Tier 1 and Tier 2 redshift ranges in grey and violet, respectively.
Current usage metrics show cumulative count of Article Views (full-text article views including HTML views, PDF and ePub downloads, according to the available data) and Abstracts Views on Vision4Press platform.
Data correspond to usage on the plateform after 2015. The current usage metrics is available 48-96 hours after online publication and is updated daily on week days.
Initial download of the metrics may take a while.