Open Access
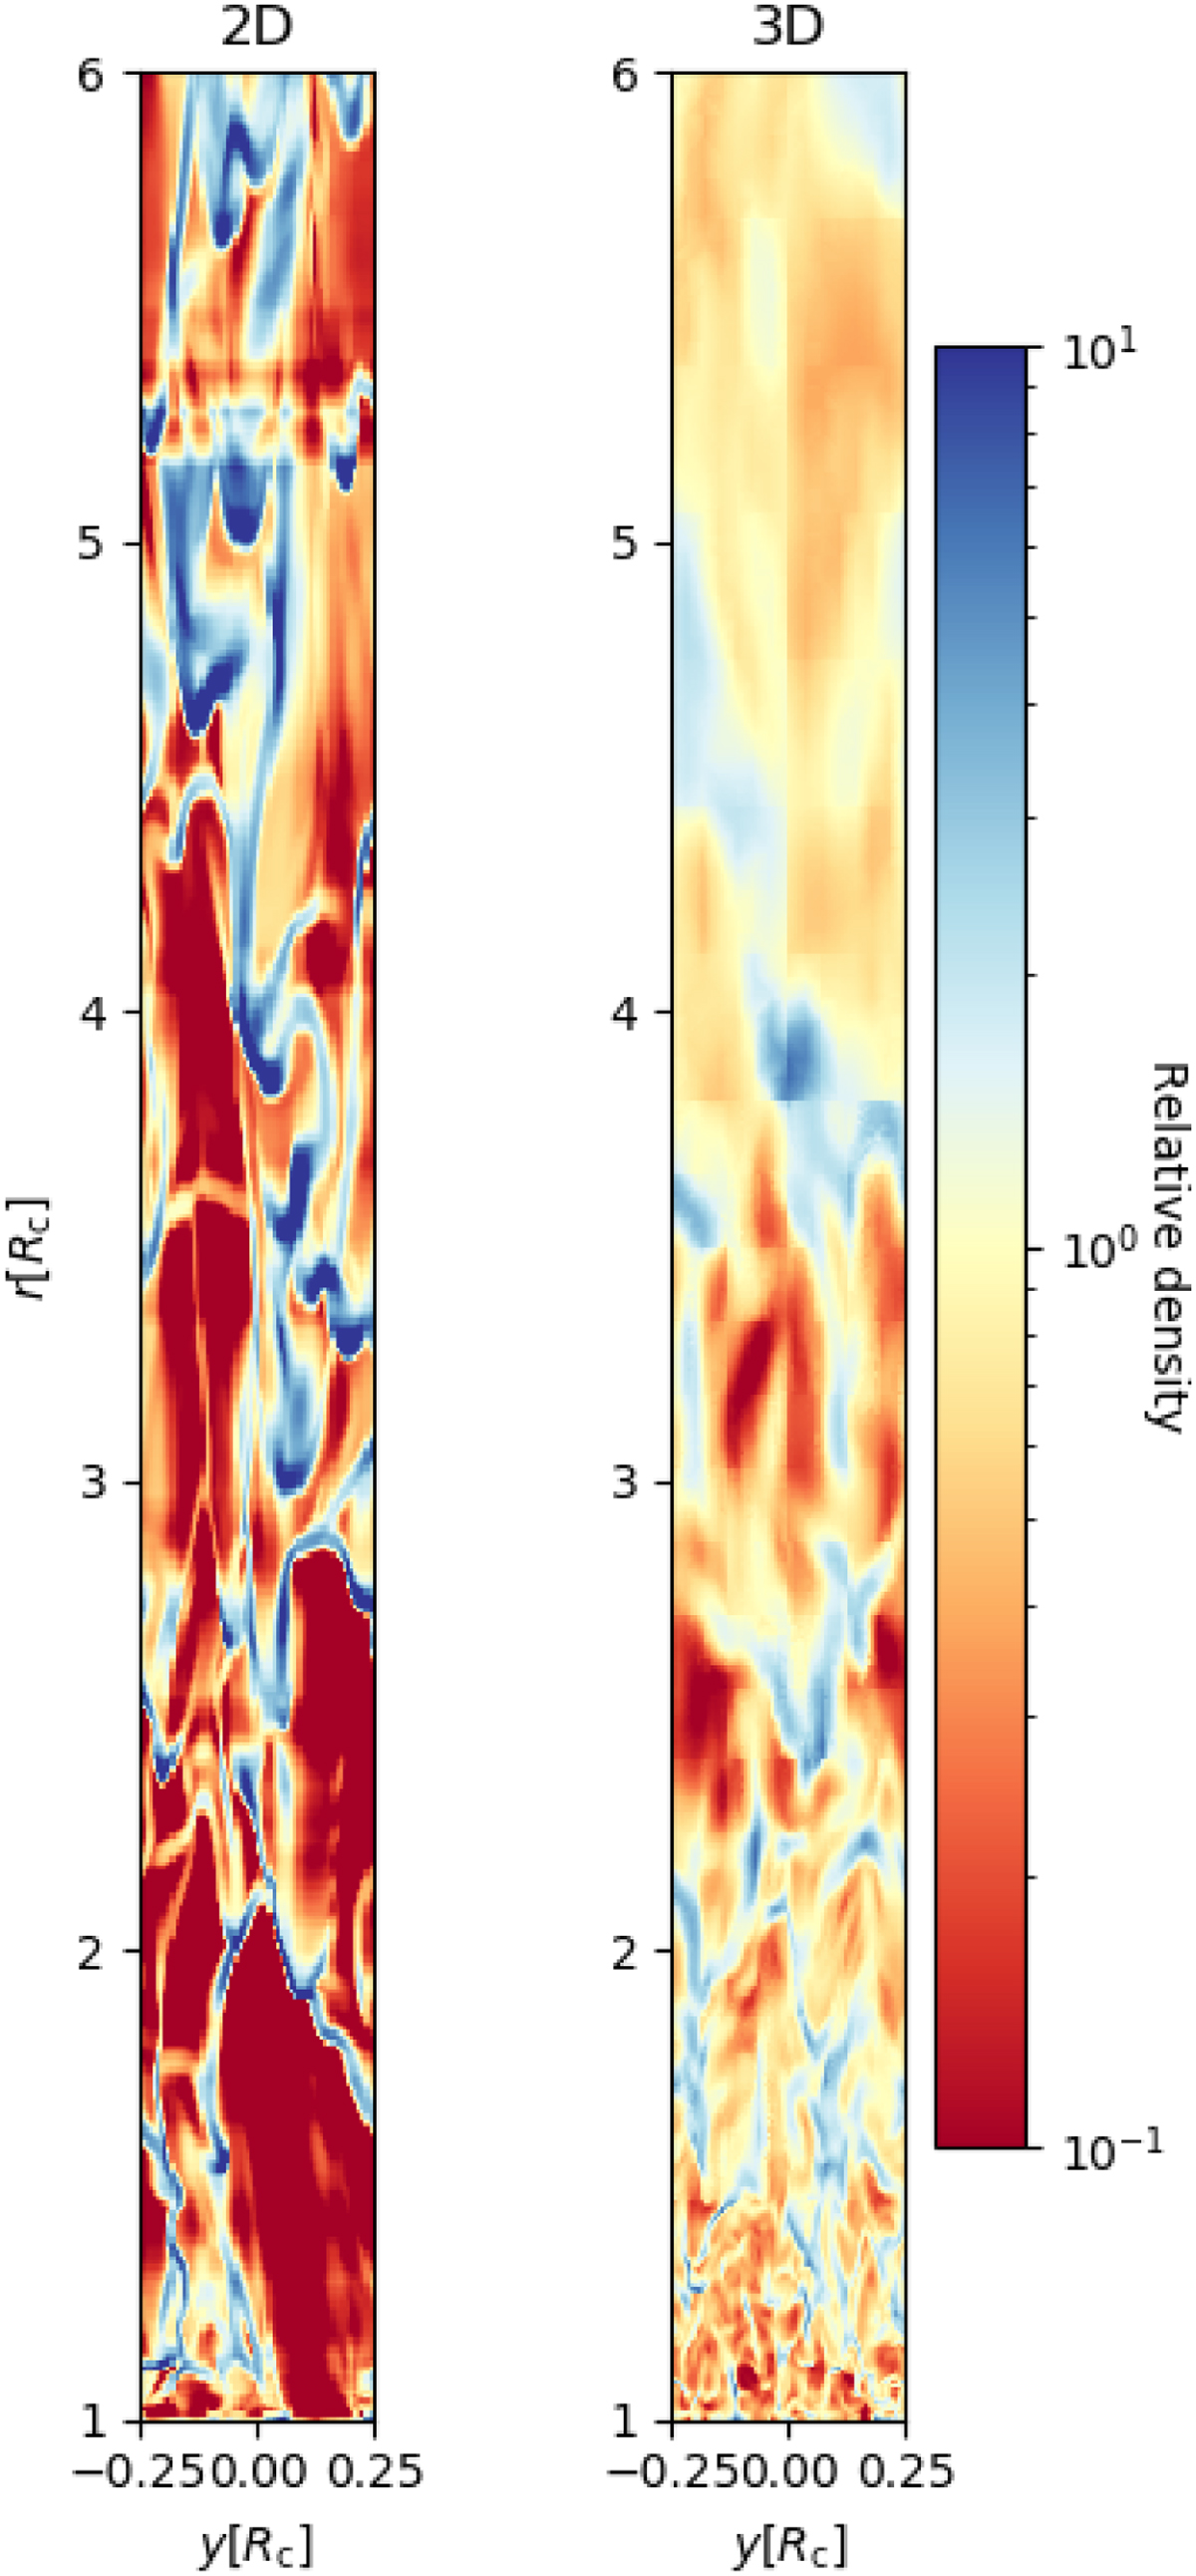
Fig. 9
Download original image
Relative density of the base model (Table 1), comparing results from a 2D setup to a 3D setup. On the left is a snapshot of the 2D model and on the right a 2D slice from the 3D model at a fixed z-coordinate. Both snapshots are taken well after numerical relaxation and are representative of the respective simulations.
Current usage metrics show cumulative count of Article Views (full-text article views including HTML views, PDF and ePub downloads, according to the available data) and Abstracts Views on Vision4Press platform.
Data correspond to usage on the plateform after 2015. The current usage metrics is available 48-96 hours after online publication and is updated daily on week days.
Initial download of the metrics may take a while.