Open Access
Fig. 7
Download original image
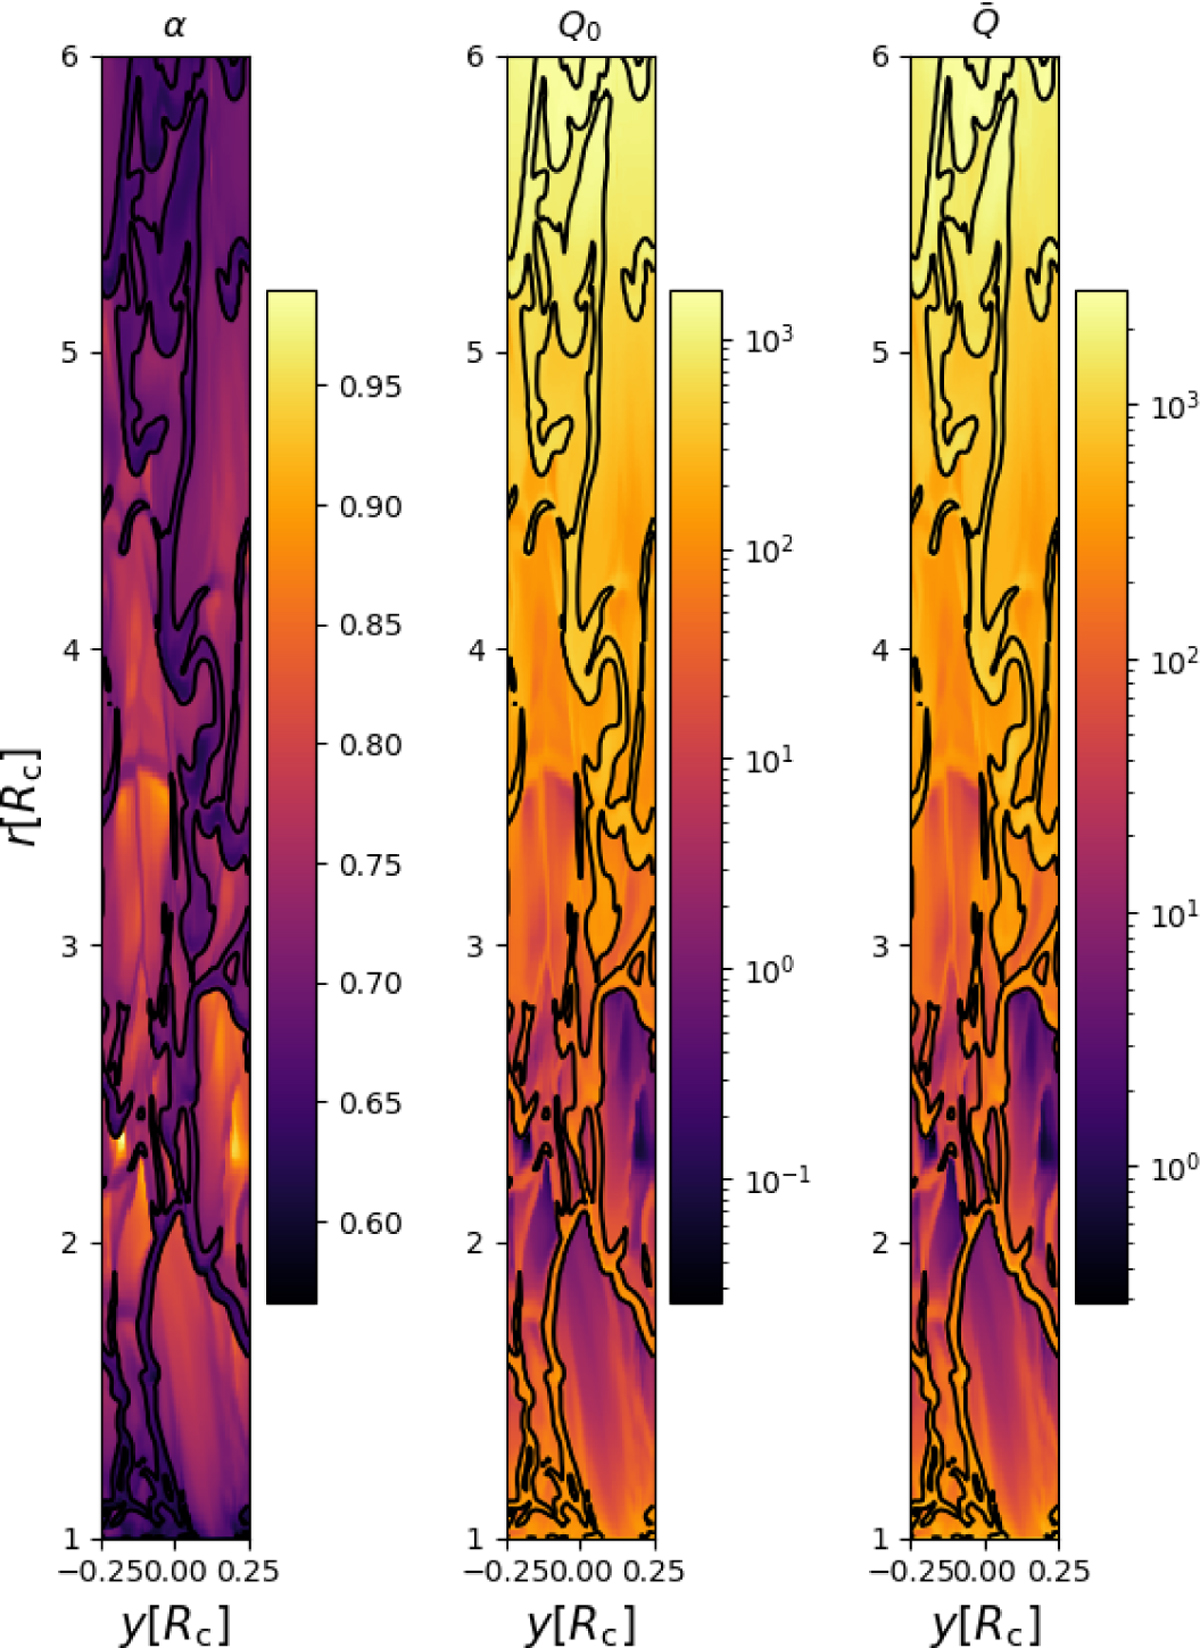
Color map of the line-force parameters. From left to right, the color in the panels represents the values for α, Q0, and ![]() for a snapshot in the 2D simulation (Table 1). The clumped structure is indicated by a black iso-contour marking a relative density of one.
for a snapshot in the 2D simulation (Table 1). The clumped structure is indicated by a black iso-contour marking a relative density of one.
Current usage metrics show cumulative count of Article Views (full-text article views including HTML views, PDF and ePub downloads, according to the available data) and Abstracts Views on Vision4Press platform.
Data correspond to usage on the plateform after 2015. The current usage metrics is available 48-96 hours after online publication and is updated daily on week days.
Initial download of the metrics may take a while.