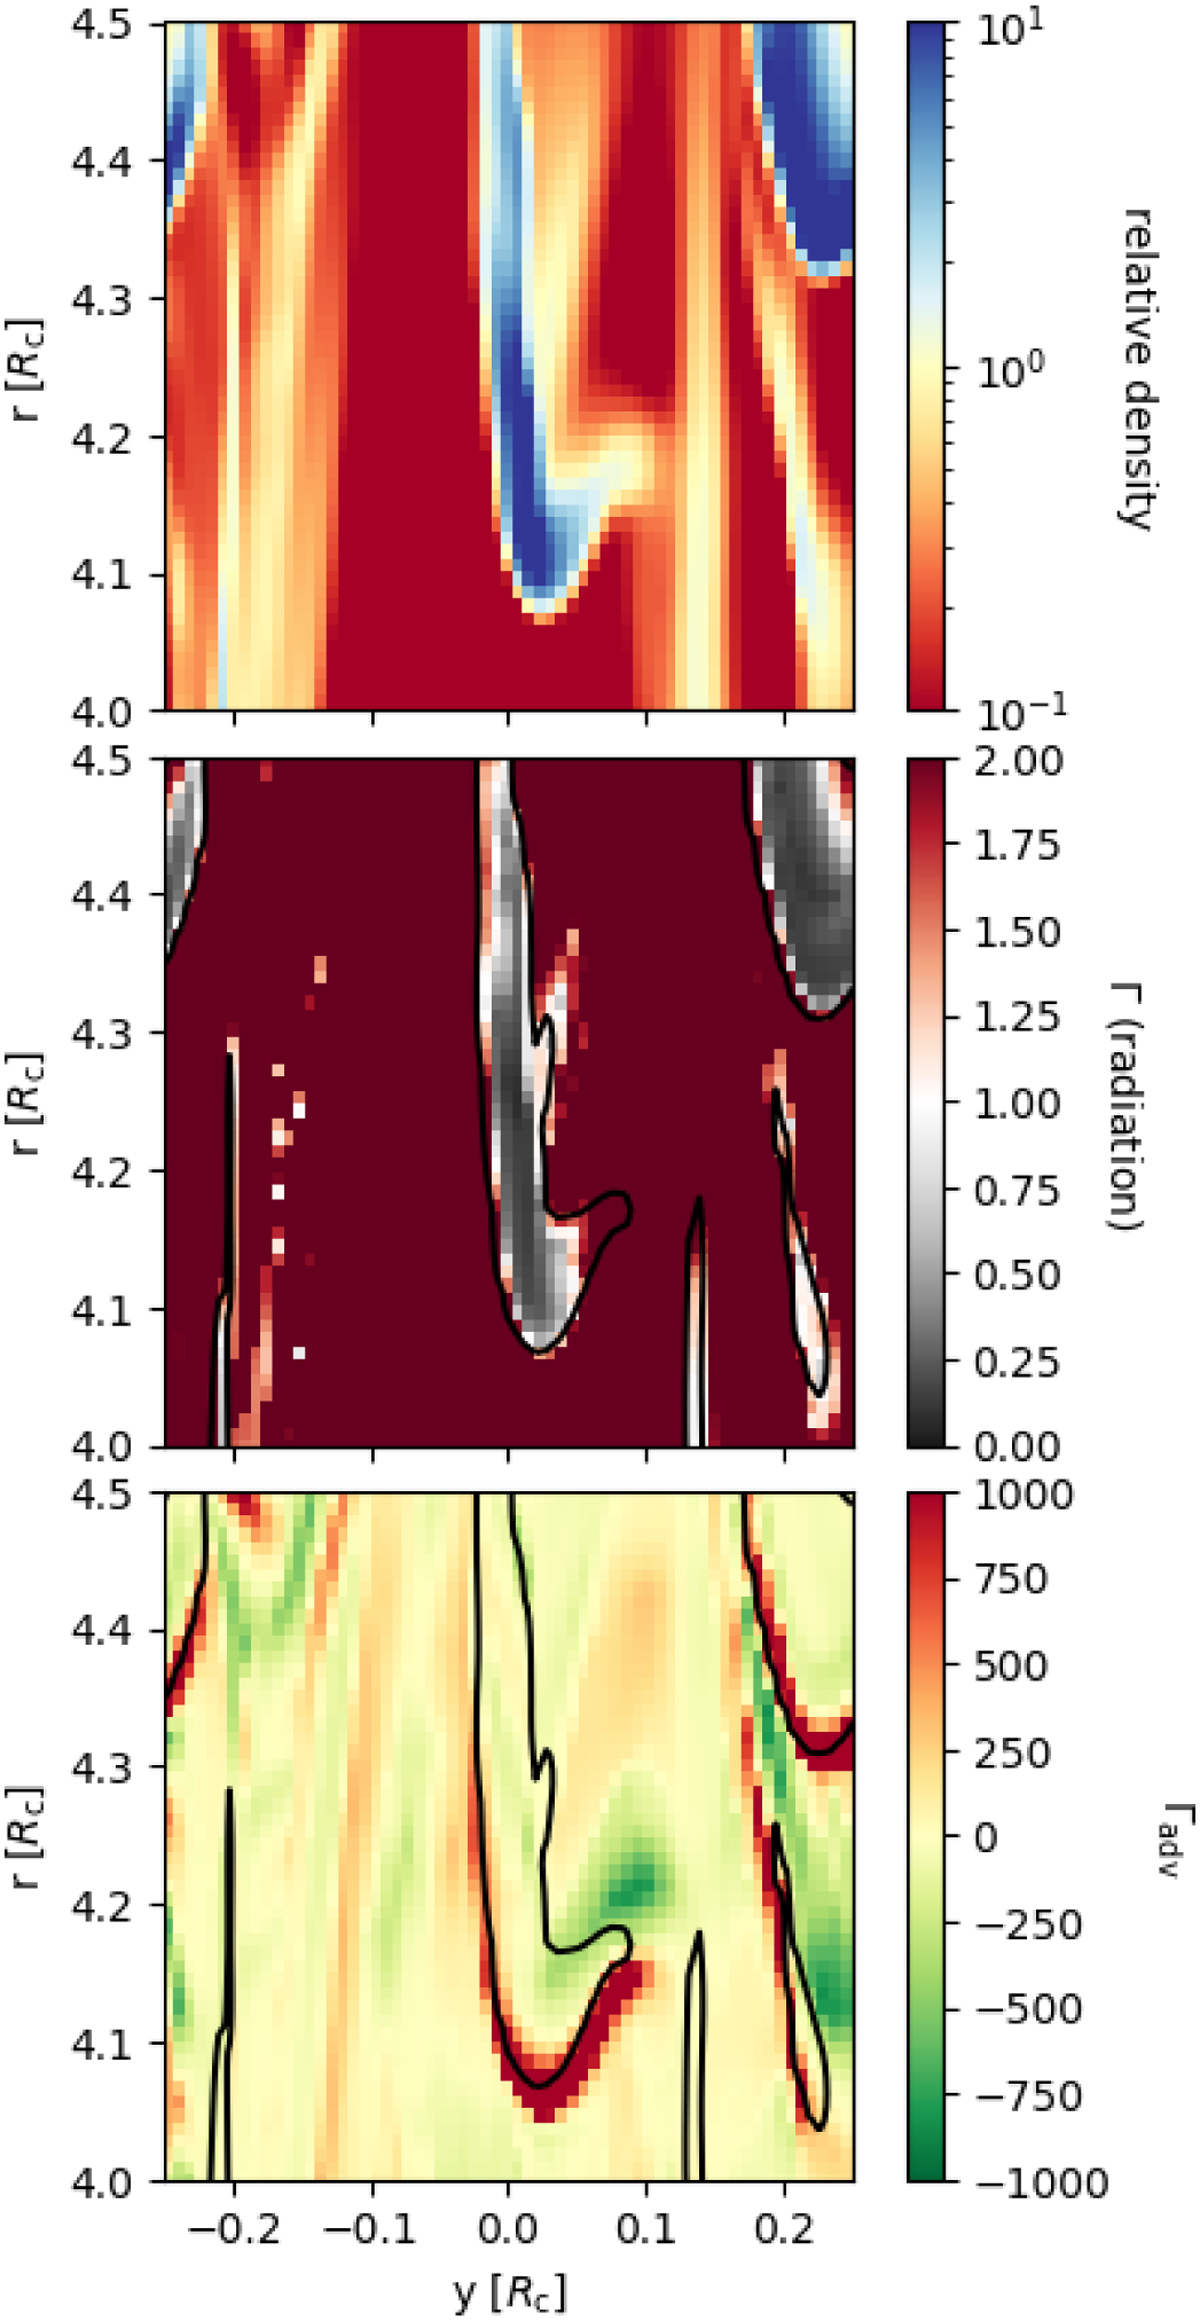
Fig. 6
Download original image
Momentum balance around a sub-Eddington clump in our 2D model (Table 1). The top panel shows the relative density where the up direction in this plot is radially outward. The bottom two panels show the Eddington factor and the ram-pressure gradient scaled to gravity, with iso-contours of relative density in black indicating the approximate location of the clump. The force distribution around this clump is characteristic of most structures observed in our simulations.
Current usage metrics show cumulative count of Article Views (full-text article views including HTML views, PDF and ePub downloads, according to the available data) and Abstracts Views on Vision4Press platform.
Data correspond to usage on the plateform after 2015. The current usage metrics is available 48-96 hours after online publication and is updated daily on week days.
Initial download of the metrics may take a while.