Fig. A.1
Download original image
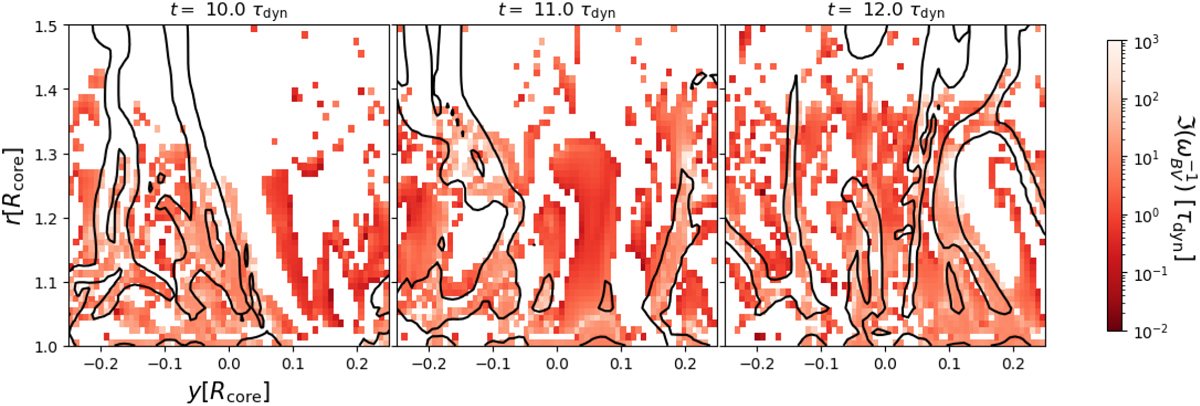
Convectively unstable zones in a series of snapshots from the 2D Γ3 model. The snapshots are taken 0.5τdyn apart, well after the transition of the initial conditions. The color map represents the inverse of the imaginary part of the radiation-modified Brunt-Väisälä frequency. Overplotted on top in black is the contour representing where the relative density is equal to one.
Current usage metrics show cumulative count of Article Views (full-text article views including HTML views, PDF and ePub downloads, according to the available data) and Abstracts Views on Vision4Press platform.
Data correspond to usage on the plateform after 2015. The current usage metrics is available 48-96 hours after online publication and is updated daily on week days.
Initial download of the metrics may take a while.