Fig. 2
Download original image
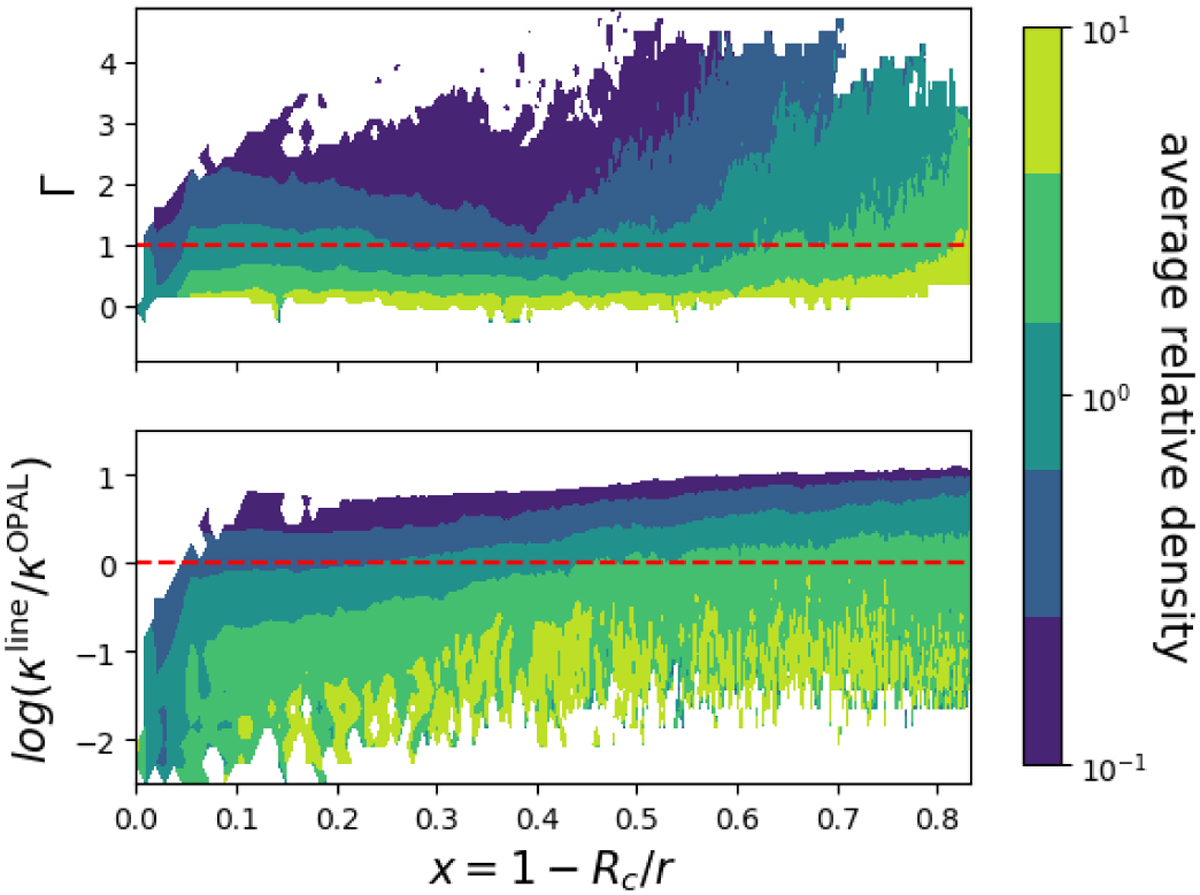
Average relative density for each Eddington factor (top panel) or ratio of opacities (bottom panel) at different radii in the 2D model (Table 1). Yellow indicates that a gas with a given Eddington factor or opacity ratio and radius is denser than the average gas at that radius, while dark blue indicates that the gas is less dense.
Current usage metrics show cumulative count of Article Views (full-text article views including HTML views, PDF and ePub downloads, according to the available data) and Abstracts Views on Vision4Press platform.
Data correspond to usage on the plateform after 2015. The current usage metrics is available 48-96 hours after online publication and is updated daily on week days.
Initial download of the metrics may take a while.